
Clarity delivered.
We help you see further and move faster, powered by your own data.
We build analytics dashboards, automated data pipelines, and AI-powered tools for telecom, distributors, and any business ready to put its data to work.


What Neat Data does
From raw transactions to real decisions
Pre-Built
Analytics

Automated Data
Pipelines

Hosted Power BI
Platform

What Our Clients Say
Real feedback from real customers


Unified data, automated reporting, better decisions
“Before partnering with Neat Data, Farmer Focus had critical business data scattered across multiple disconnected systems – leaving product managers without clear sales visibility and staff bogged down in manual reporting for farmer partners and feed suppliers. Neat Data unified everything into a single source of truth, automating the manual reporting and giving every team the visibility they needed to move faster and make better decisions.”

From manual reports to on-demand insights
“Before implementing Neat Data, reporting relied on an outdated platform pulling data directly from an AS400 database. Support staff had to manually run reports and email them out, which consumed IT time and delayed access to business insights. Neat Data replaced that process with pre-built dashboards designed specifically for the distribution industry. Now users can log in and access sales insights on demand, suppliers can view their own performance without involving internal staff, and IT time that was once spent fulfilling report requests is freed up for higher-value work. The visibility across departments has created real operational benefits. Sales teams can quickly identify customer trends and product performance, Accounts Receivable has clearer insight into aging and collections activity, Accounts Payable can better track purchasing and vendor activity, and Inventory teams gain improved visibility into movement, turns, and stock levels to support smarter ordering decisions.”


Streamlined analysis across two ERP systems
“The Neat Data dashboards offer a straightforward and comprehensive summary of our sales data, enabling us to swiftly analyze gains and losses. This capability enhances our evaluation of raw material planning. Additionally, these dashboards facilitated the integration of two separate ERP systems, consolidating historical data for streamlined analysis.”

The Sales Intelligence Ladder
A clear path from scattered sales data to AI-driven sales automation

01
Consolidated Sales Data

02
Sales Reporting

03
Custom Categorizations

04
Sales Performance Analysis

05
Goals to Actuals

06
Automated Distribution

07

Sales Coach

08
Automation
Choose your platform
Neat Data works with the systems you already use.
QuickBooks Online


MORE INFORMATION

QuickBooks Desktop
MORE INFORMATION

Epicor P21
MORE INFORMATION

NCR Power Enterprise
MORE INFORMATION

General ERPs
MORE INFORMATION

Rave Retailer
MORE INFORMATION

Telecommunications
MORE INFORMATION

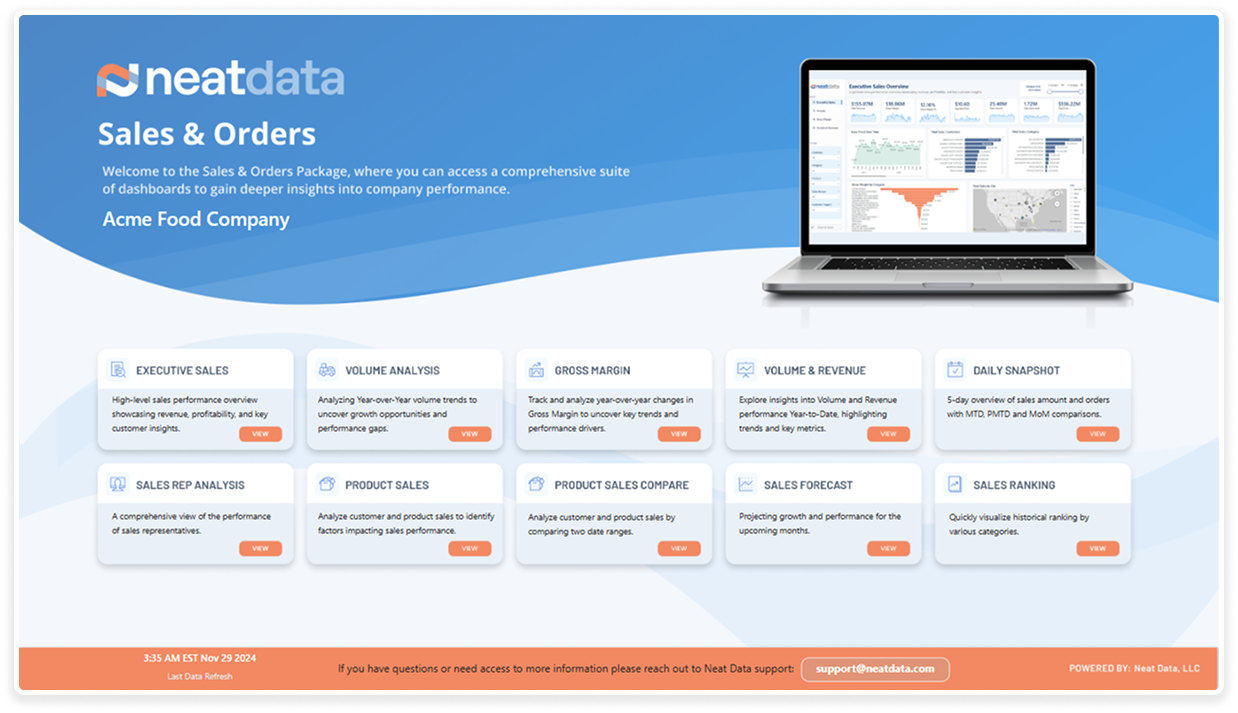
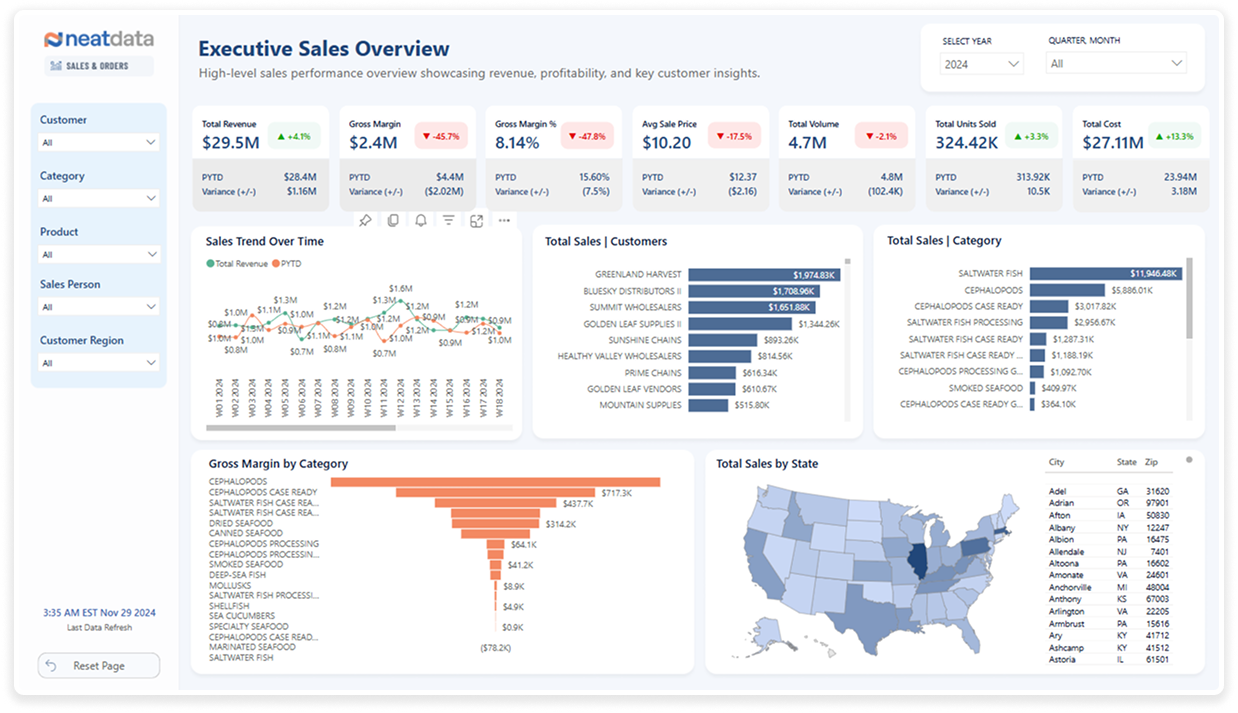
Dashboard Visual Gallery
Dashboards are Power BI–native and optimized for large NCR Power Enterprise datasets.
Who Neat Data is For
Built for growing B2B companies

Distributors & wholesalers
Inventory-driven businesses
Telecom providers
Finance, operations, and sales leaders
Companies with high transaction volumes
From $1M SMBs to enterprise operations.

Why Neat Data?
Why companies choose Neat Data?
Native system reports

Excel & spreadsheets
Custom BI projects
Neat Data

Professional Services
Support when you need it
Services

Implementation & onboarding
Custom dashboards & KPIs
Advisory & advanced analytics