Neat Data for Telecommunications
Advanced analytics for telecommunications providers — built on 30 years of industry experience

Neat Data Is a Telecommunications Analytics Platform
Neat Data acts as a purpose-built analytics connector and platform for telecommunications environments, integrating data across billing systems, OSS/BSS platforms, customer systems, and operational tools—then delivering it into a fully managed Power BI environment.

No brittle spreadsheets.
No one-off reports.
No disconnected systems.
Built on 30 Years of Telecom Data Experience
Local exchange carriers
Fiber and broadband providers
Wireless and fixed wireless operators
Regional and rural telecom organizations
Core Telecom Analytics Modules
Neat Data for Telecommunications includes multiple pre-built analytics modules, each with dozens of interactive report pages, designed around real telecom workflows.
01
Billed Revenue Analytics
Billed revenue by customer, service, and product Revenue trends by geography and service type New vs recurring revenue Billing accuracy and variance analysis Drillthrough to invoice and billing records
02
Customer Behavior & Service Line Analytics
Customer tenure and lifecycle analysis
Product take rates and bundling behavior
Service line growth and contraction
Add / change / disconnect trends
Cross-sell and upsell visibility
03
Churn & Retention Analytics
Service line churn rates Customer churn indicators Voluntary vs involuntary churn Early-warning churn signals Retention opportunity identification
04
Regulatory & Compliance Reporting
Regulatory reporting datasets
Historical trend tracking
Data validation and audit support
Consistent, repeatable reporting
Reduced manual compliance effort
05
Customer Service & Trouble Ticket Analytics
Ticket volume and aging
Resolution times and SLA tracking
Root cause and repeat issue analysis
Customer impact visibility
Support team workload trends
06
Field Service & Technician Analytics
Technician productivity and utilization
Work order volume and completion rates
Time-on-task analysis
Geographic workload distribution
Field service efficiency metrics
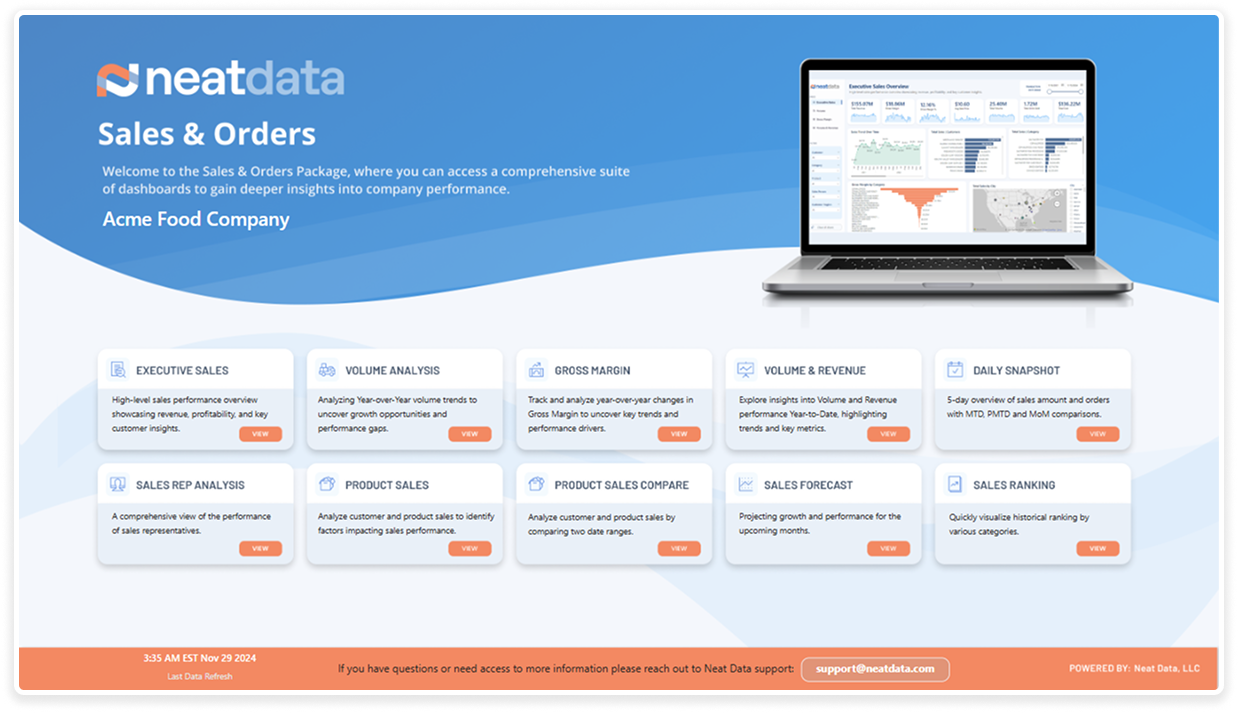
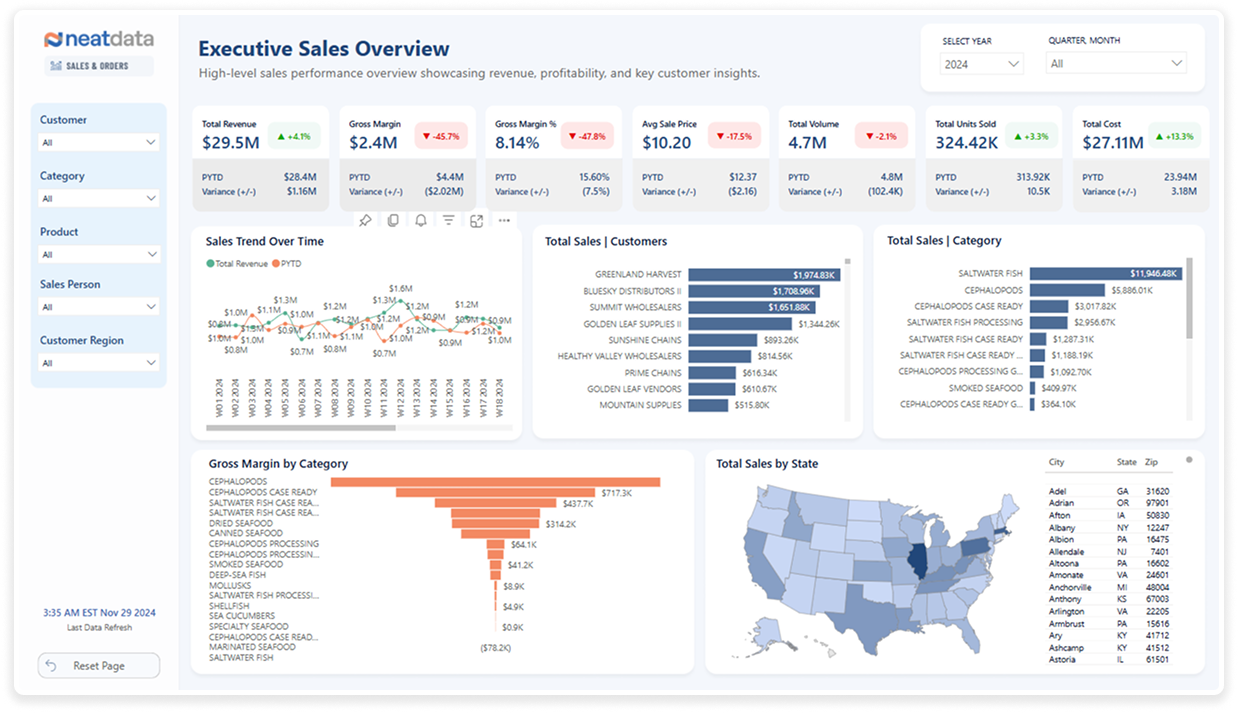
Explore the full set of Power BI dashboards
Dashboard Visual Gallery
Dashboards are optimized for high-volume telecom datasets and long historical timelines.
Supported Telecom Data Sources
Billing and rating systems
OSS / BSS platforms
CRM and customer systems
Trouble ticketing systems
Field service and workforce management tools
Automated Data Refresh
Always Current.
Always Trusted.

Daily refresh

Hourly refresh
Who This Is For
Neat Data for Telecommunications is built for:
Telecom service providers
Broadband and fiber operators
Wireless and fixed wireless providers
Finance, operations, and regulatory teams
Organizations managing complex service portfolios
If telecom data runs your business, Neat Data helps you understand, optimize, and defend it.
