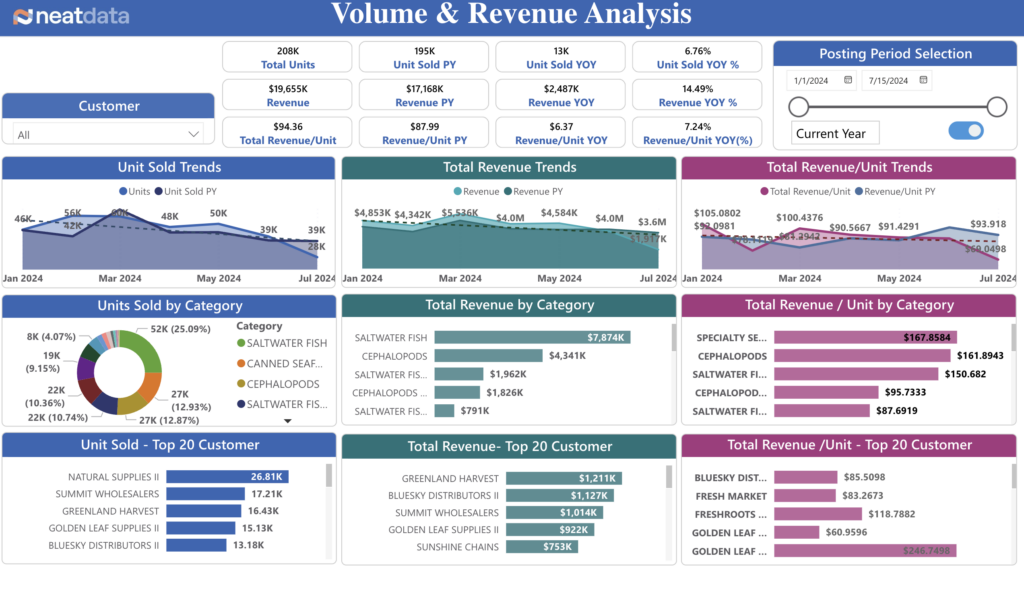
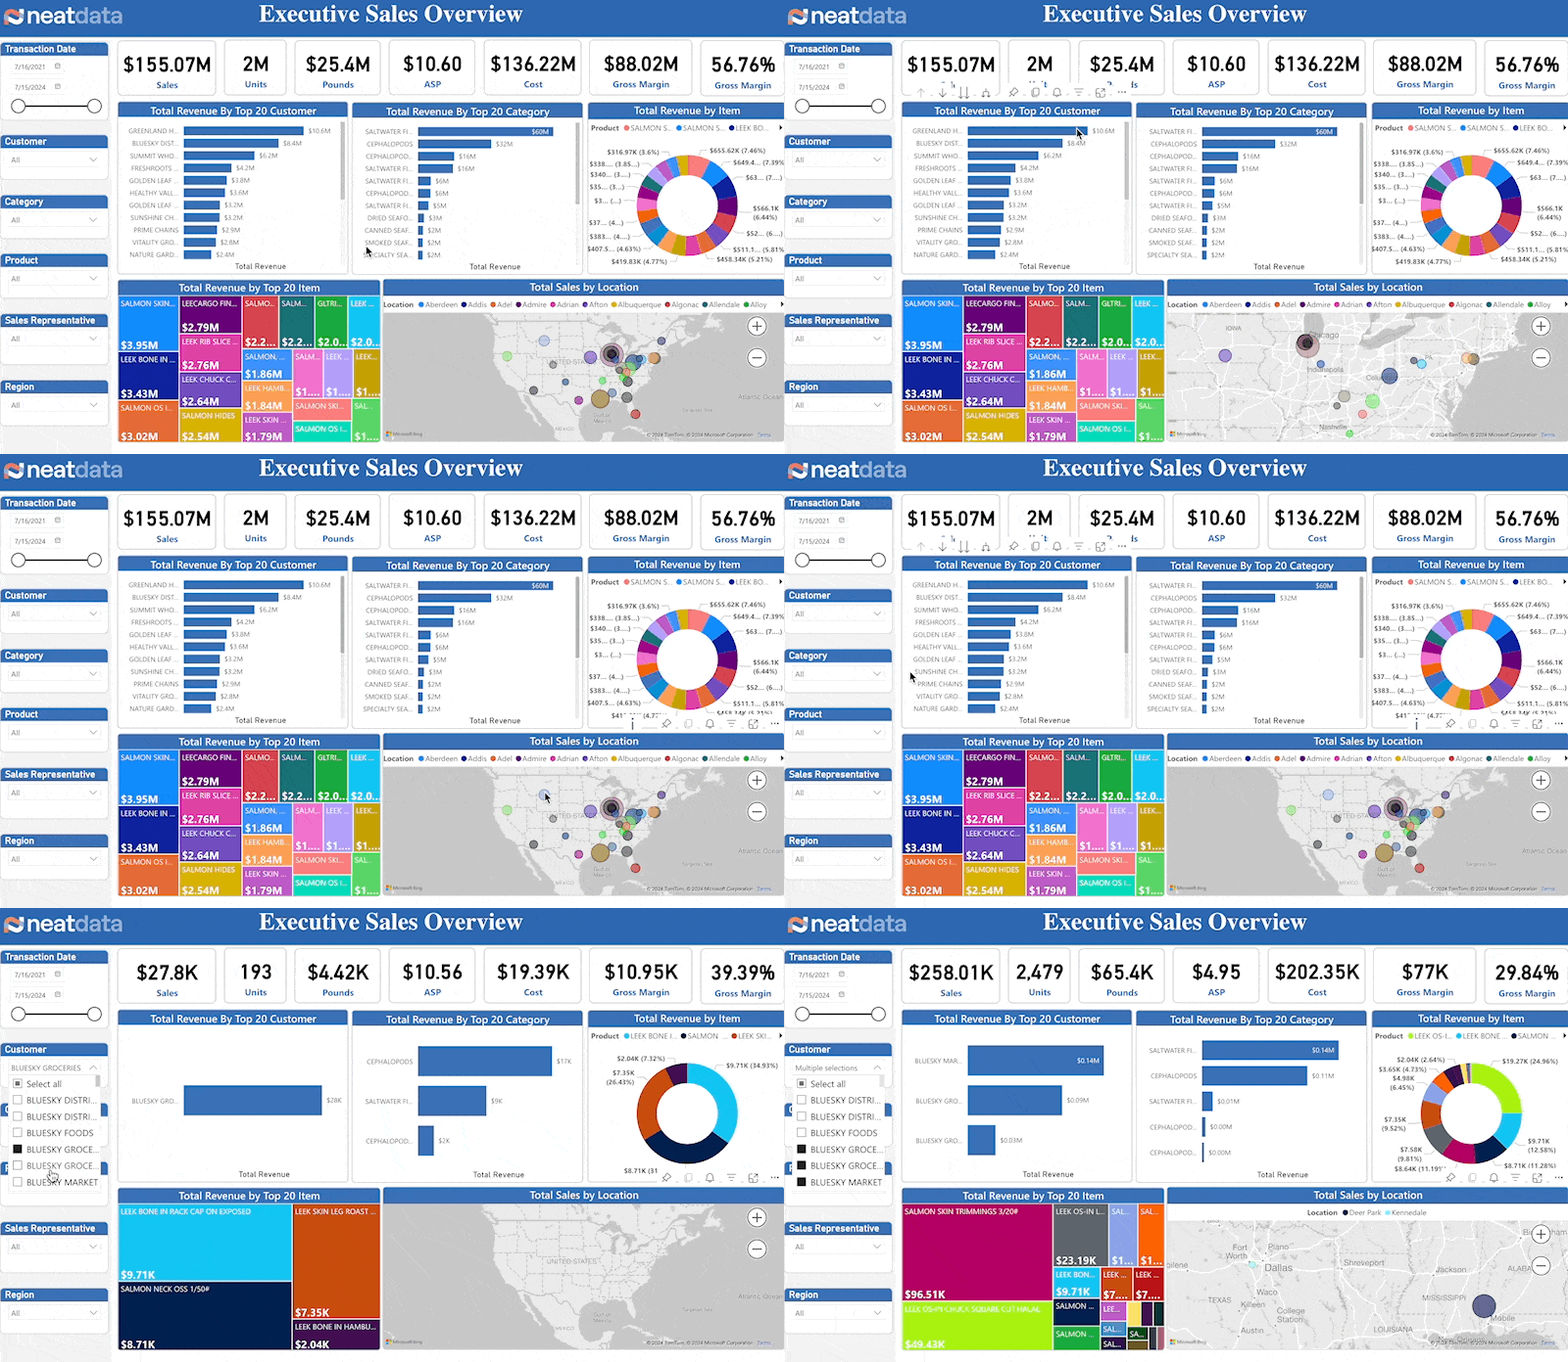
There’s no doubt that identifying top-selling products and sales trends in your business is crucial for sales teams, product teams, and supply chain analysts.
This helps you reallocate resources more effectively and optimize your inventory. However, in large food companies with thousands of sales transactions per month, it becomes nearly impossible to produce reliable reports for such metrics.
Hence why management needs to opt for more efficient calculation solutions, that not only promise accurate results but are economical too.
Let’s explore this in more detail.
Understanding Customer Sales Volume Changes
In simple words, customer sales volume changes refer to the analyses of sales metrics such as how much of each product is being sold to customers over time. For food sales companies, this helps in identifying trends, seasonal patterns, and shifts in customer preferences.
The purpose of such reports is to aid companies make informed decisions about product management, marketing strategies, and product development to better meet customer needs and drive business growth. Some key factors to include in these reports are:
- Detailed Breakdown of Product Sales by Customer: Analyzing sales data by types of clients helps in customizing strategies and understanding specific customer needs.
- Tracking Sales Variance of Each Product: Identifying specific kinds of products with significant sales variance highlights room for improvement or adjustment.
- Assessing Customer Purchase Patterns: Recognizing changes in client purchasing behavior enables active adjustments in marketing and sales approaches.
- Understanding Seasonal Sales Trends for Each Product: Seasonal variations impact sales differently for various products. Therefore, recognizing these trends aids in forecasting and planning.

Time Intelligence Analysis – Detect Changes in Customer Sales Volume
Product sales reporting for decreasing or increasing sales volume in food companies is not enough. Often, these results must also be provided across many time dimensions.
- Analyzing Year-over-Year (YoY) Sales Totals: Comparing sales figures from the current year with the previous year. This is to provide insights into growth or decline trends.
- Comparing Year-to-Date (YTD) Sales Figures: Understanding sales totals year-to-date. This aids in assessing performance and making informed decisions.
- Monitoring Monthly and Quarterly Sales Trends: Tracking sales trends on a monthly and quarterly basis. This helps reveal seasonal patterns and fluctuations in food transactions.
- Weekly Trends: Monitoring weekly sales trends to provide a detailed and up-to-date picture of sales performance in different food products.
- Using Sales Performance Metrics: Metrics such as sales dollars, units sold, and average sales price (ASP). These offer a comprehensive view of food product performance.
What’s Next… After Identifying Change in Customer’s Sales Volume?
Once an analyst has realized a change in a customer’s sales volume, an important question arises: What has caused this change?
To pinpoint the exact food products decreasing or increasing sales volume, the analyst will then need time intelligence analysis. This is where they will perform a detailed breakdown of each customer’s Year-over-Year (YoY) and Year-to-Date (YTD) totals by the food products they purchase.
The process involves dividing sales data by individual food products. Next, it compares their performance across different time periods.
Once this step is complete, it is important to consider various product nuances. What this means is that a product might have been affected due to seasonal variations while others might be influenced by market trends or promotional activities.

Finally, once the analysis is complete, the food companies can take targeted actions. This includes optimized product marketing, customized food products, etc, to progress towards increasing sales volume.
By thoroughly understanding which products are impacting customer sales volumes, food companies can make strategic decisions that drive business growth, enhance customer satisfaction, and maintain a competitive edge in the market.
The Final Verdict
Food sales reporting and analysis can be incredibly complex. As discussed earlier, it involves digging deep into year-over-year (YoY) and year-to-date (YTD) sales by customers and products.
By breaking down this data and understanding product performance nuances, companies can focus on increasing sales volume and optimize their marketing strategies to better meet customer needs.
There’s no doubt that accurate and efficient analysis is key to staying competitive in the food industry. However, these calculations can be quite exhaustive, often leading to faulty or unreliable results.
Neat Data – What You’re Looking For!
To make this process easier and gain valuable insights, we recommend going digital with these analyses. Sure, a spreadsheet will get you there…eventually. However, a robust software solution that quickly and accurately calculates YoY and YTD sales offers a superior alternative and will help in increasing sales volume.
We’re talking about the specialized food packages offered by Neat Data. It offers an analytics platform that helps calculate customer sales volume and track changes specifically for the food industry.
It’s time food companies embrace the power of Neat Data’s ERP system to streamline sales reporting and analysis, ensuring accurate, reliable insights for better decision-making.
Afterall…Why should you settle for less?
