Welcome to the Dashboard Series where we highlight best data visualization practices and real-life effective information on sales dashboards.
The Dashboard Series - Must-Have Daily Sales Dashboard for Food Industry Finance Leaders
Finance teams bring a unique perspective to business insights, especially when it comes to sales reporting. Their daily requirements are straightforward yet essential: tracking month-over-month growth, analyzing sales figures, monitoring order counts, and assessing volume. To make informed decisions, finance needs the ability to slice these metrics across various dimensions—by company, category, product, and sales representative.
The Metrics
The core sales metrics are straight forward and self-explanatory. These include:
- sales amount,
- units, average sales price (ASP),
- cost,
- gross margin, and
- gross margin percentage.
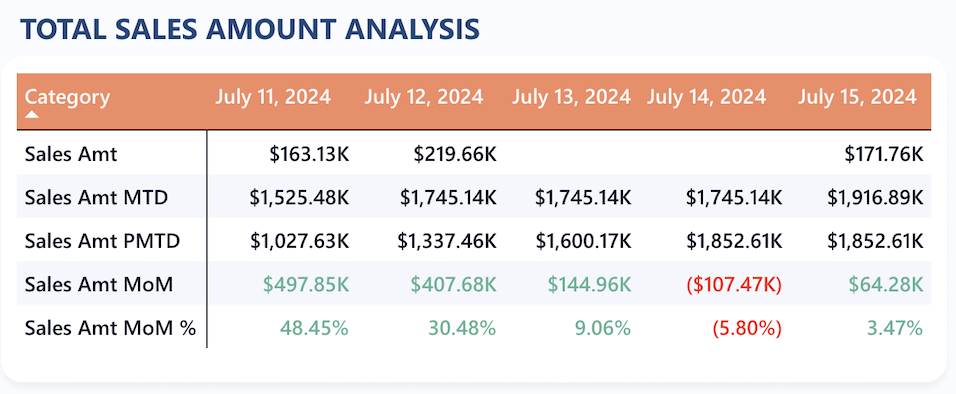
Sales Amount Month-over-Month
This summary table says it all. MoM performance for the most important metrics for the past 5 days.
Daily Sales for the Month
See your recent daily trend for the past month to understand the sales velocity.

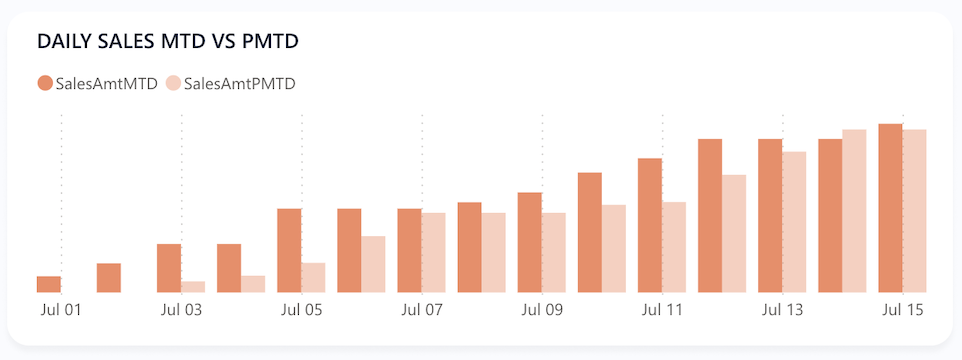
Compare to Last Month Daily Sales
Ensure you are increasing sales when compared to the same day of the previous month.
Key Features
Effective sales dashboards have fundamental business user capabilities. Sales leaders are sophisiticated and expect this functionality.
Slicers
A good sales dashboard provides several means for slicing a dashboard’s data. Clicking on a chart’s pie slice or bar can cause the entire dashboard to adjust for that value. Dropdown combo boxes and buttons can also provide precise slicers.
Drill Down
Drill down is used within a visual to navigate through hierarchical data. For instance, when viewing a sales amount by sales rep chart, users may want to drill down on a single sales rep to see a summary of products sold.
Drill Through
Drill through is used to navigate to a different report page that provides more detailed information related to a selected data point. For instance, users might want to click on a sales rep in a chart and see the underslying sales transactions.
More Important Sales Dashboards for Finance
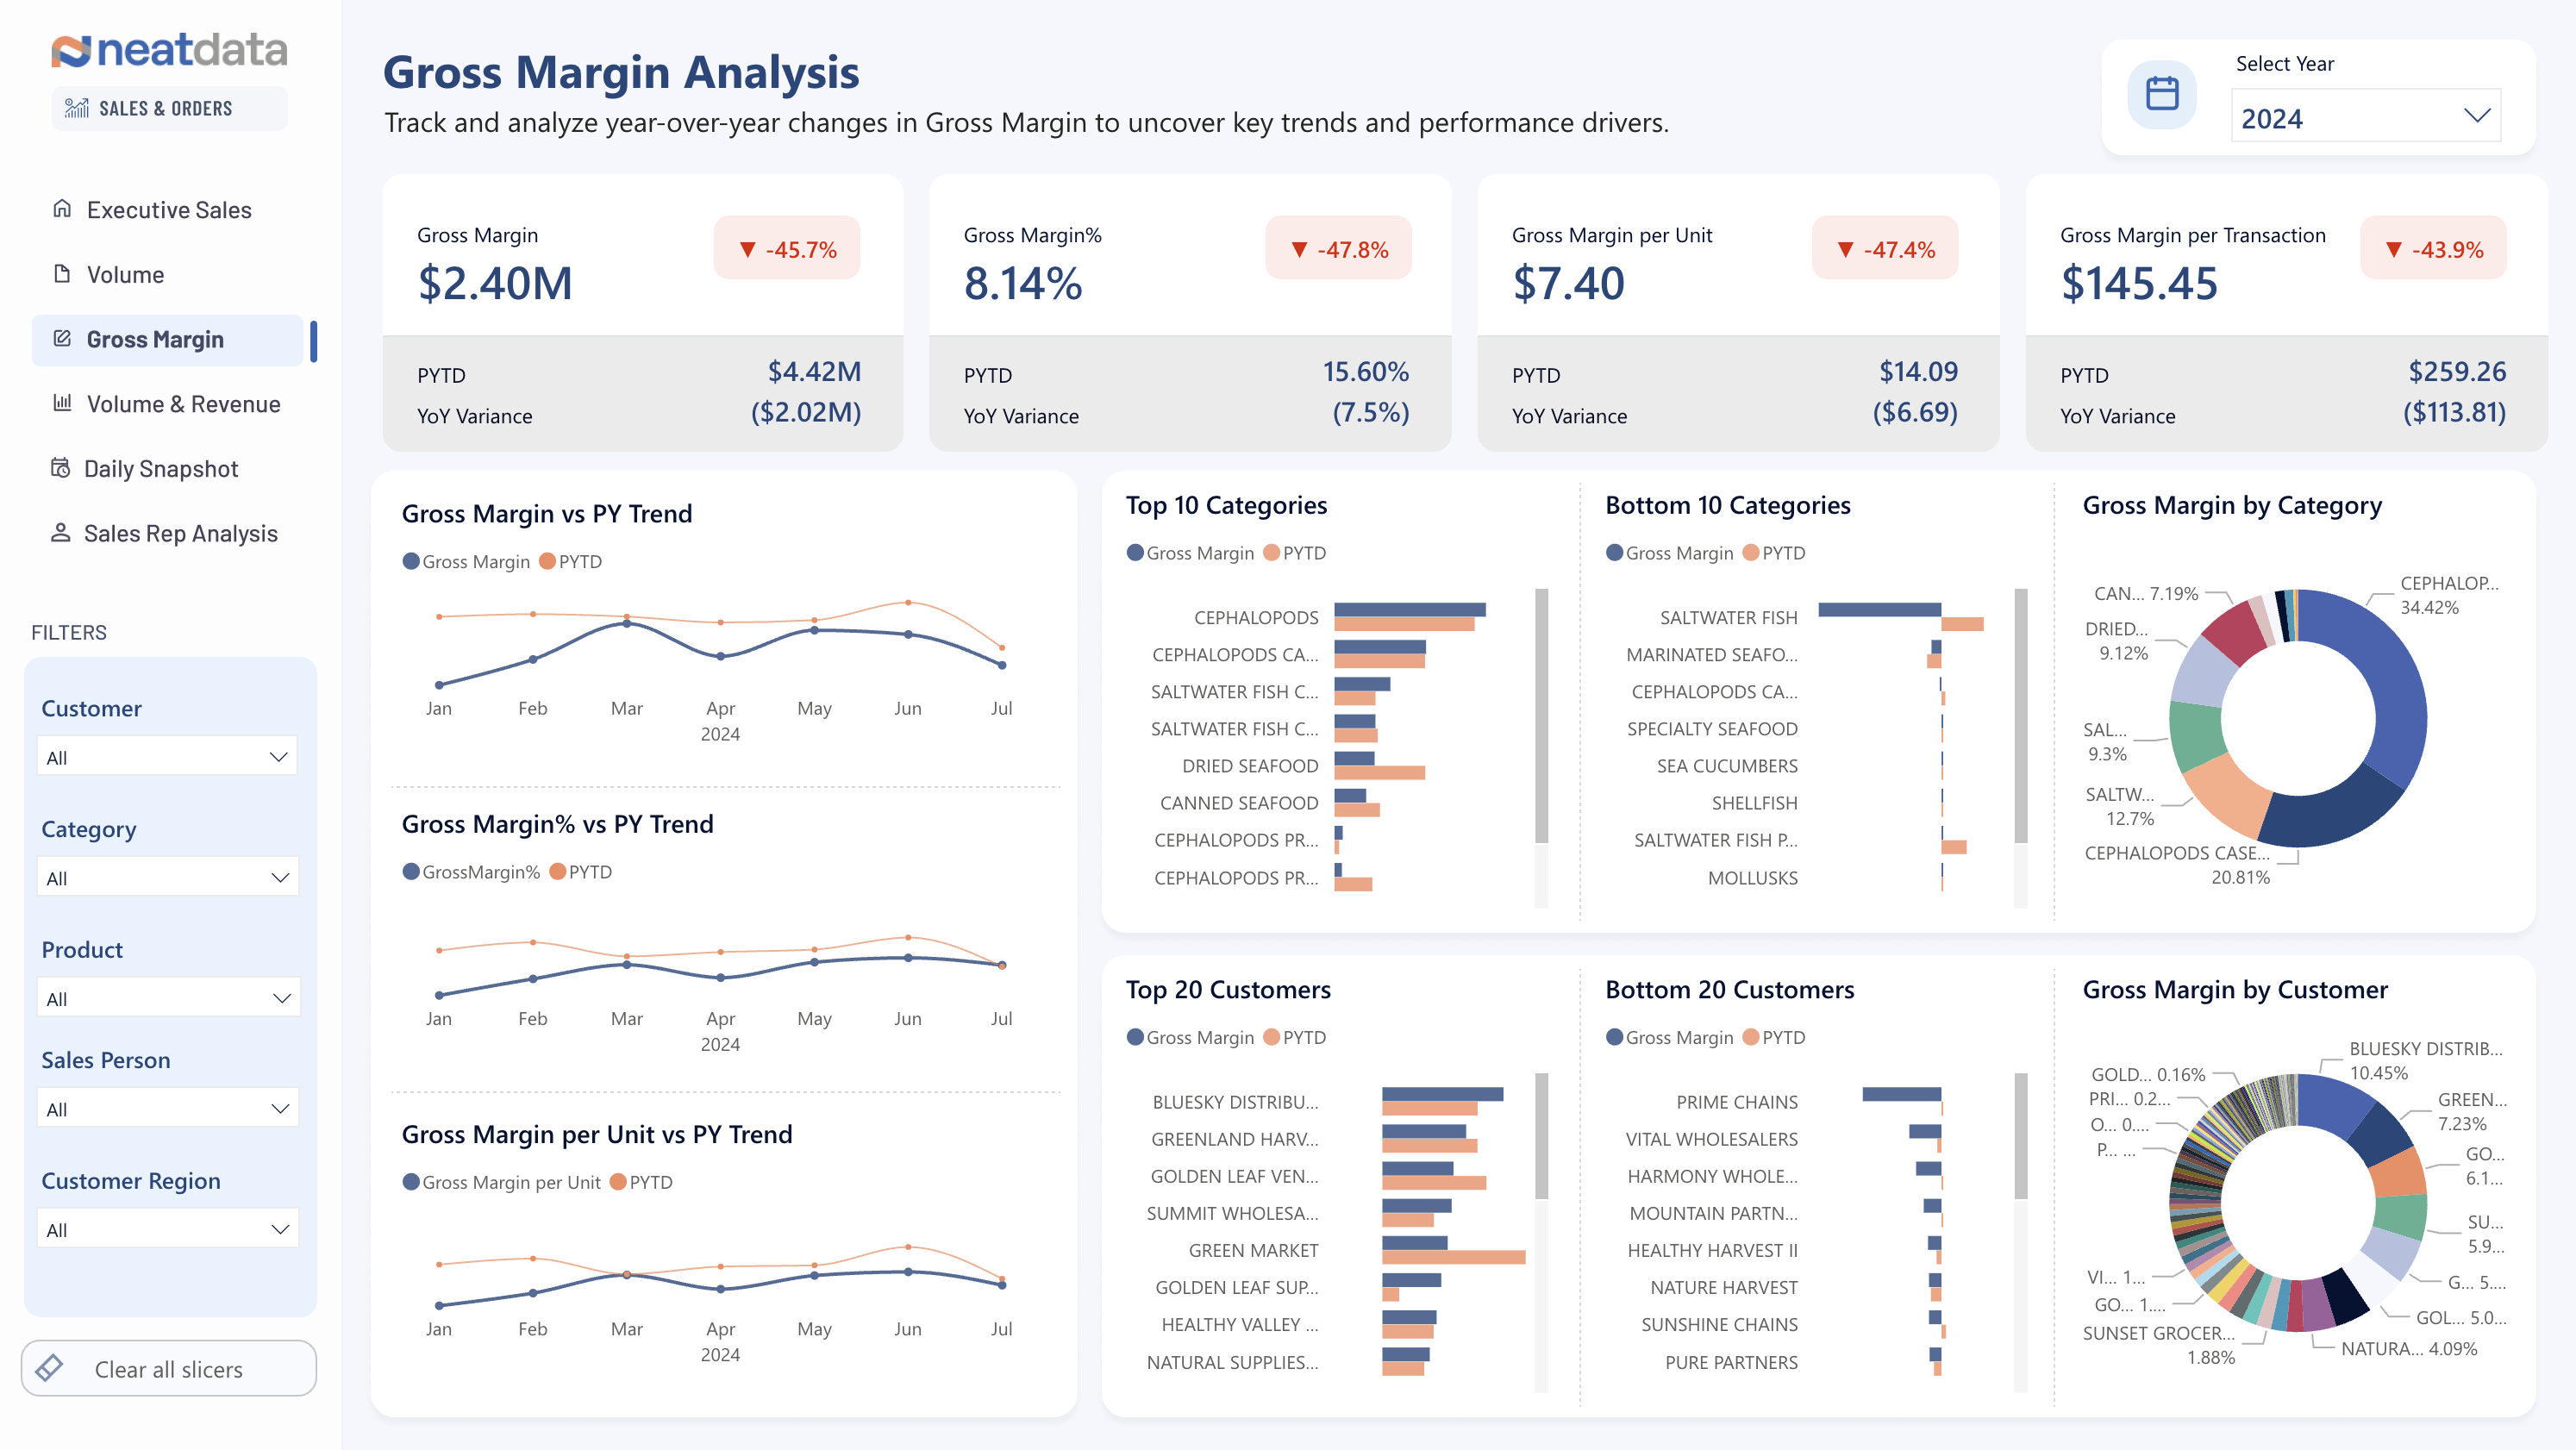
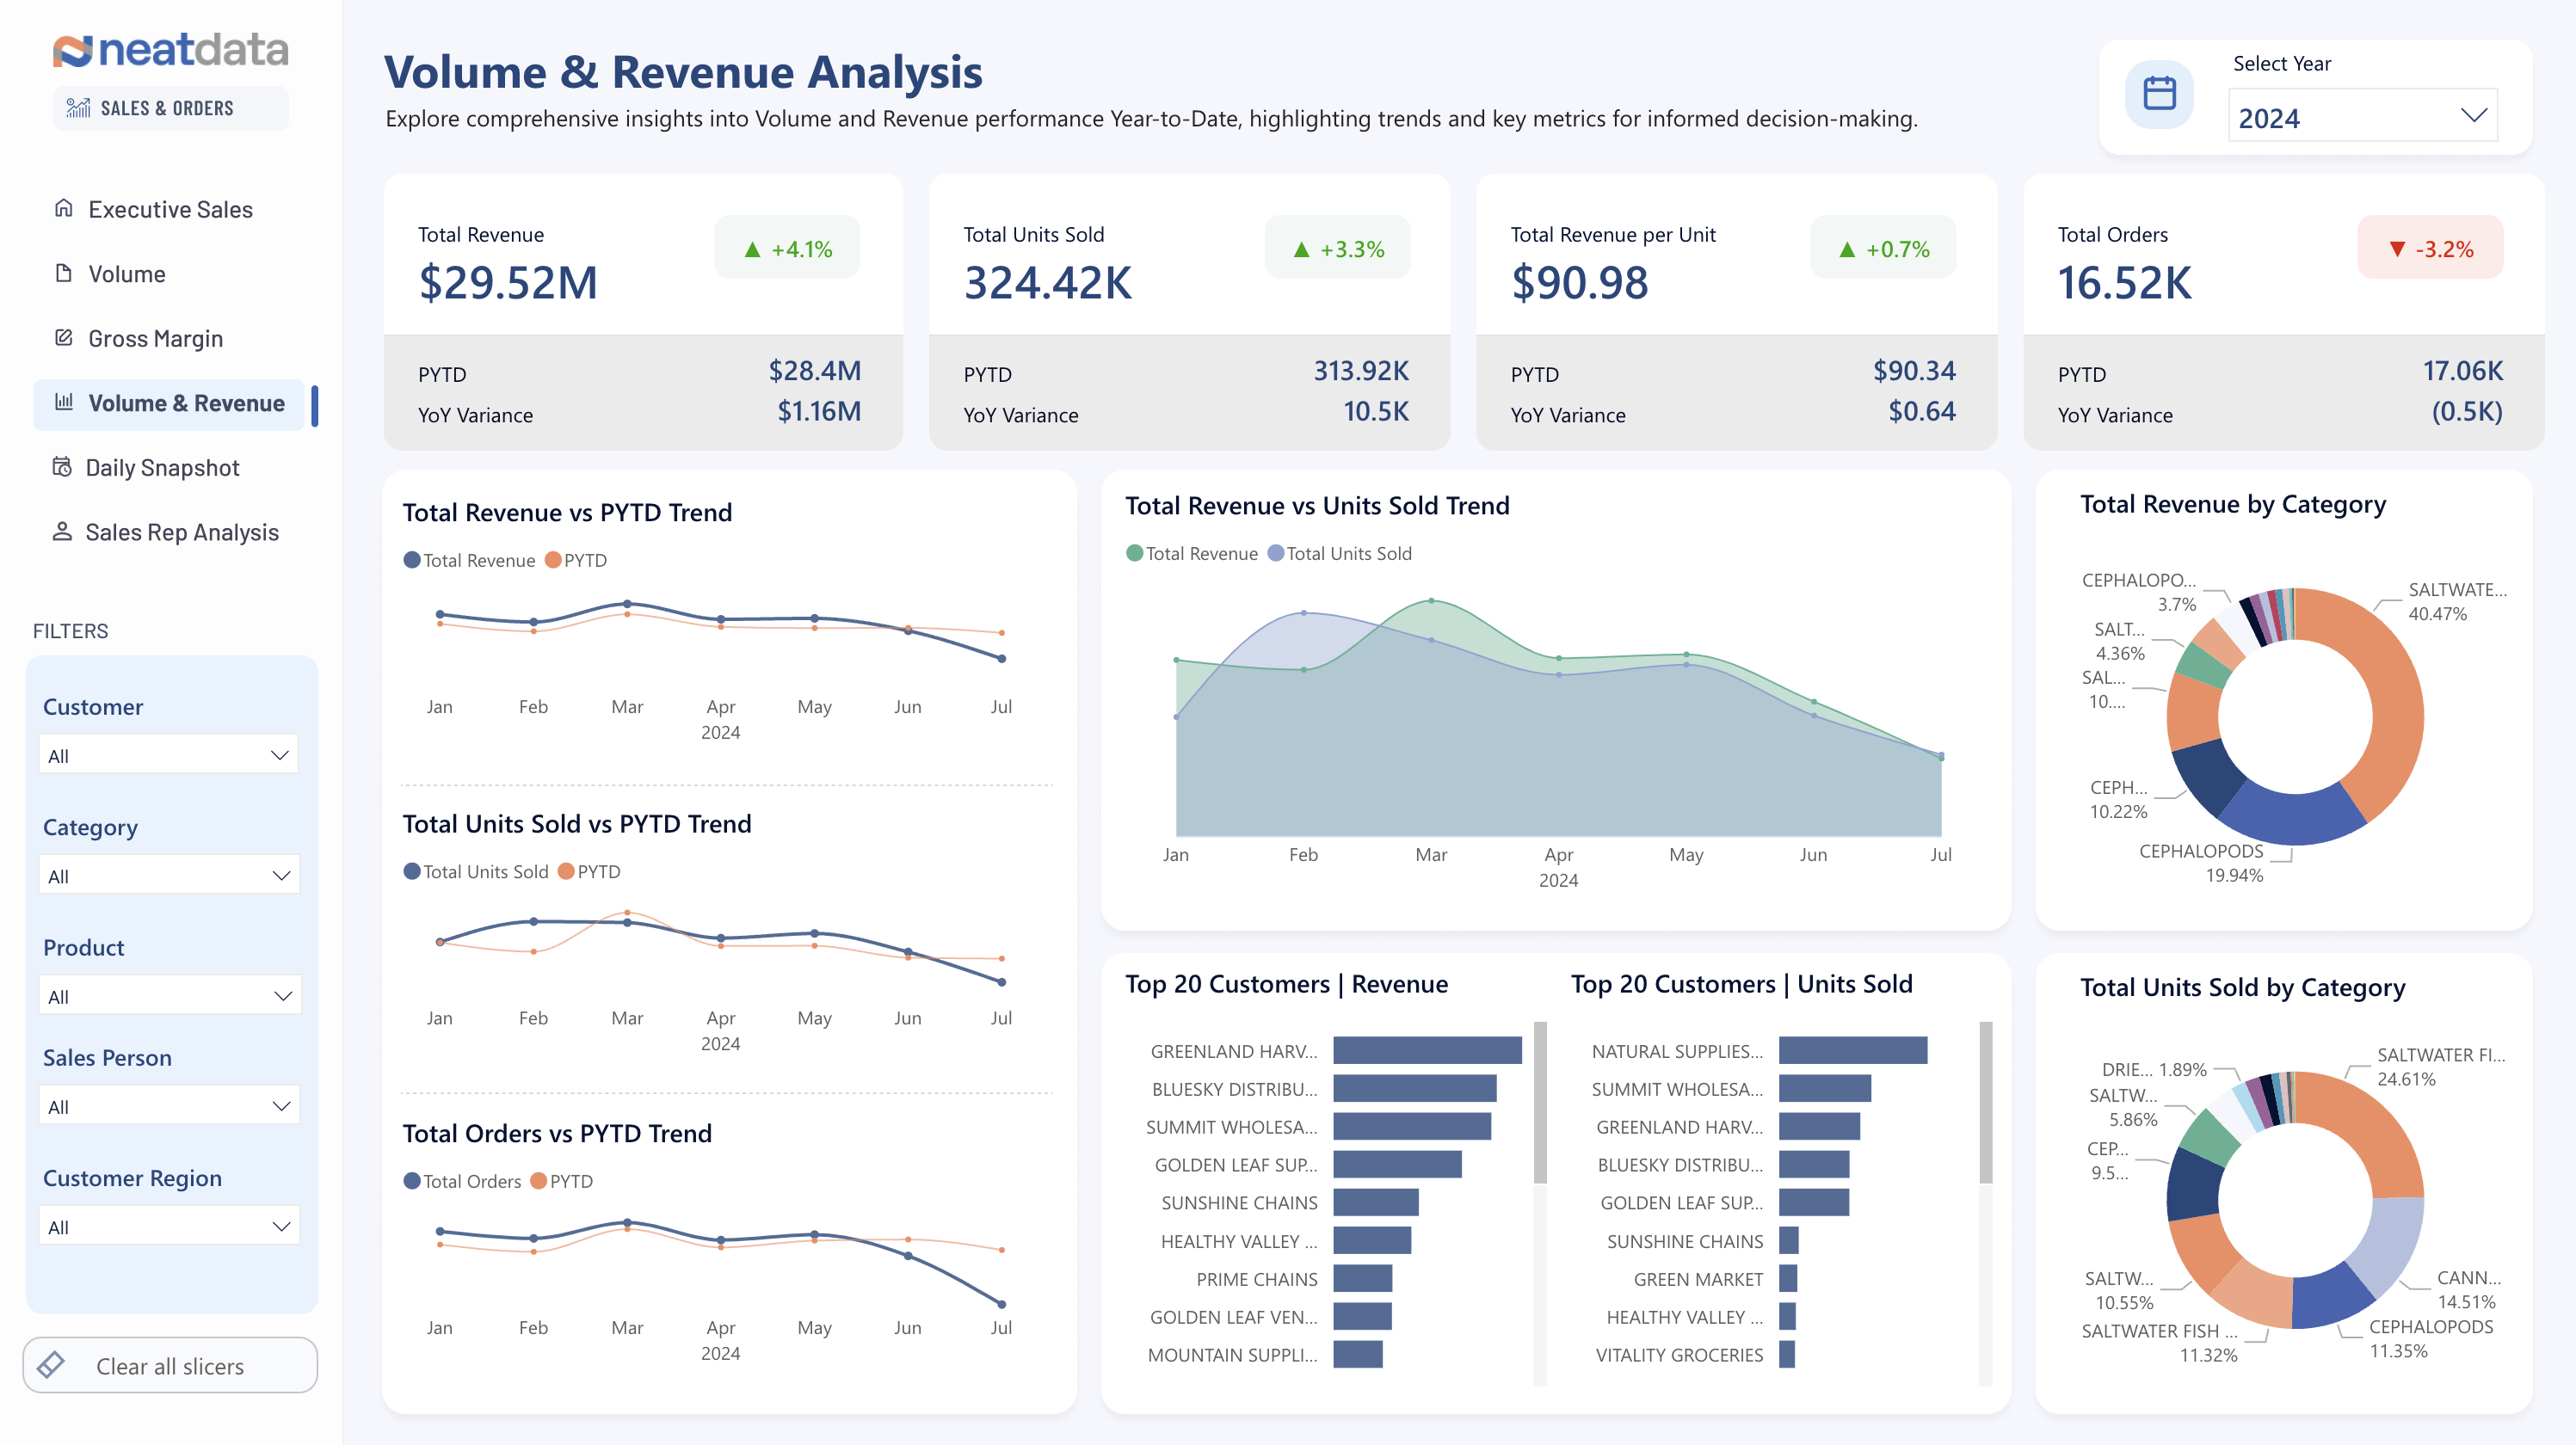
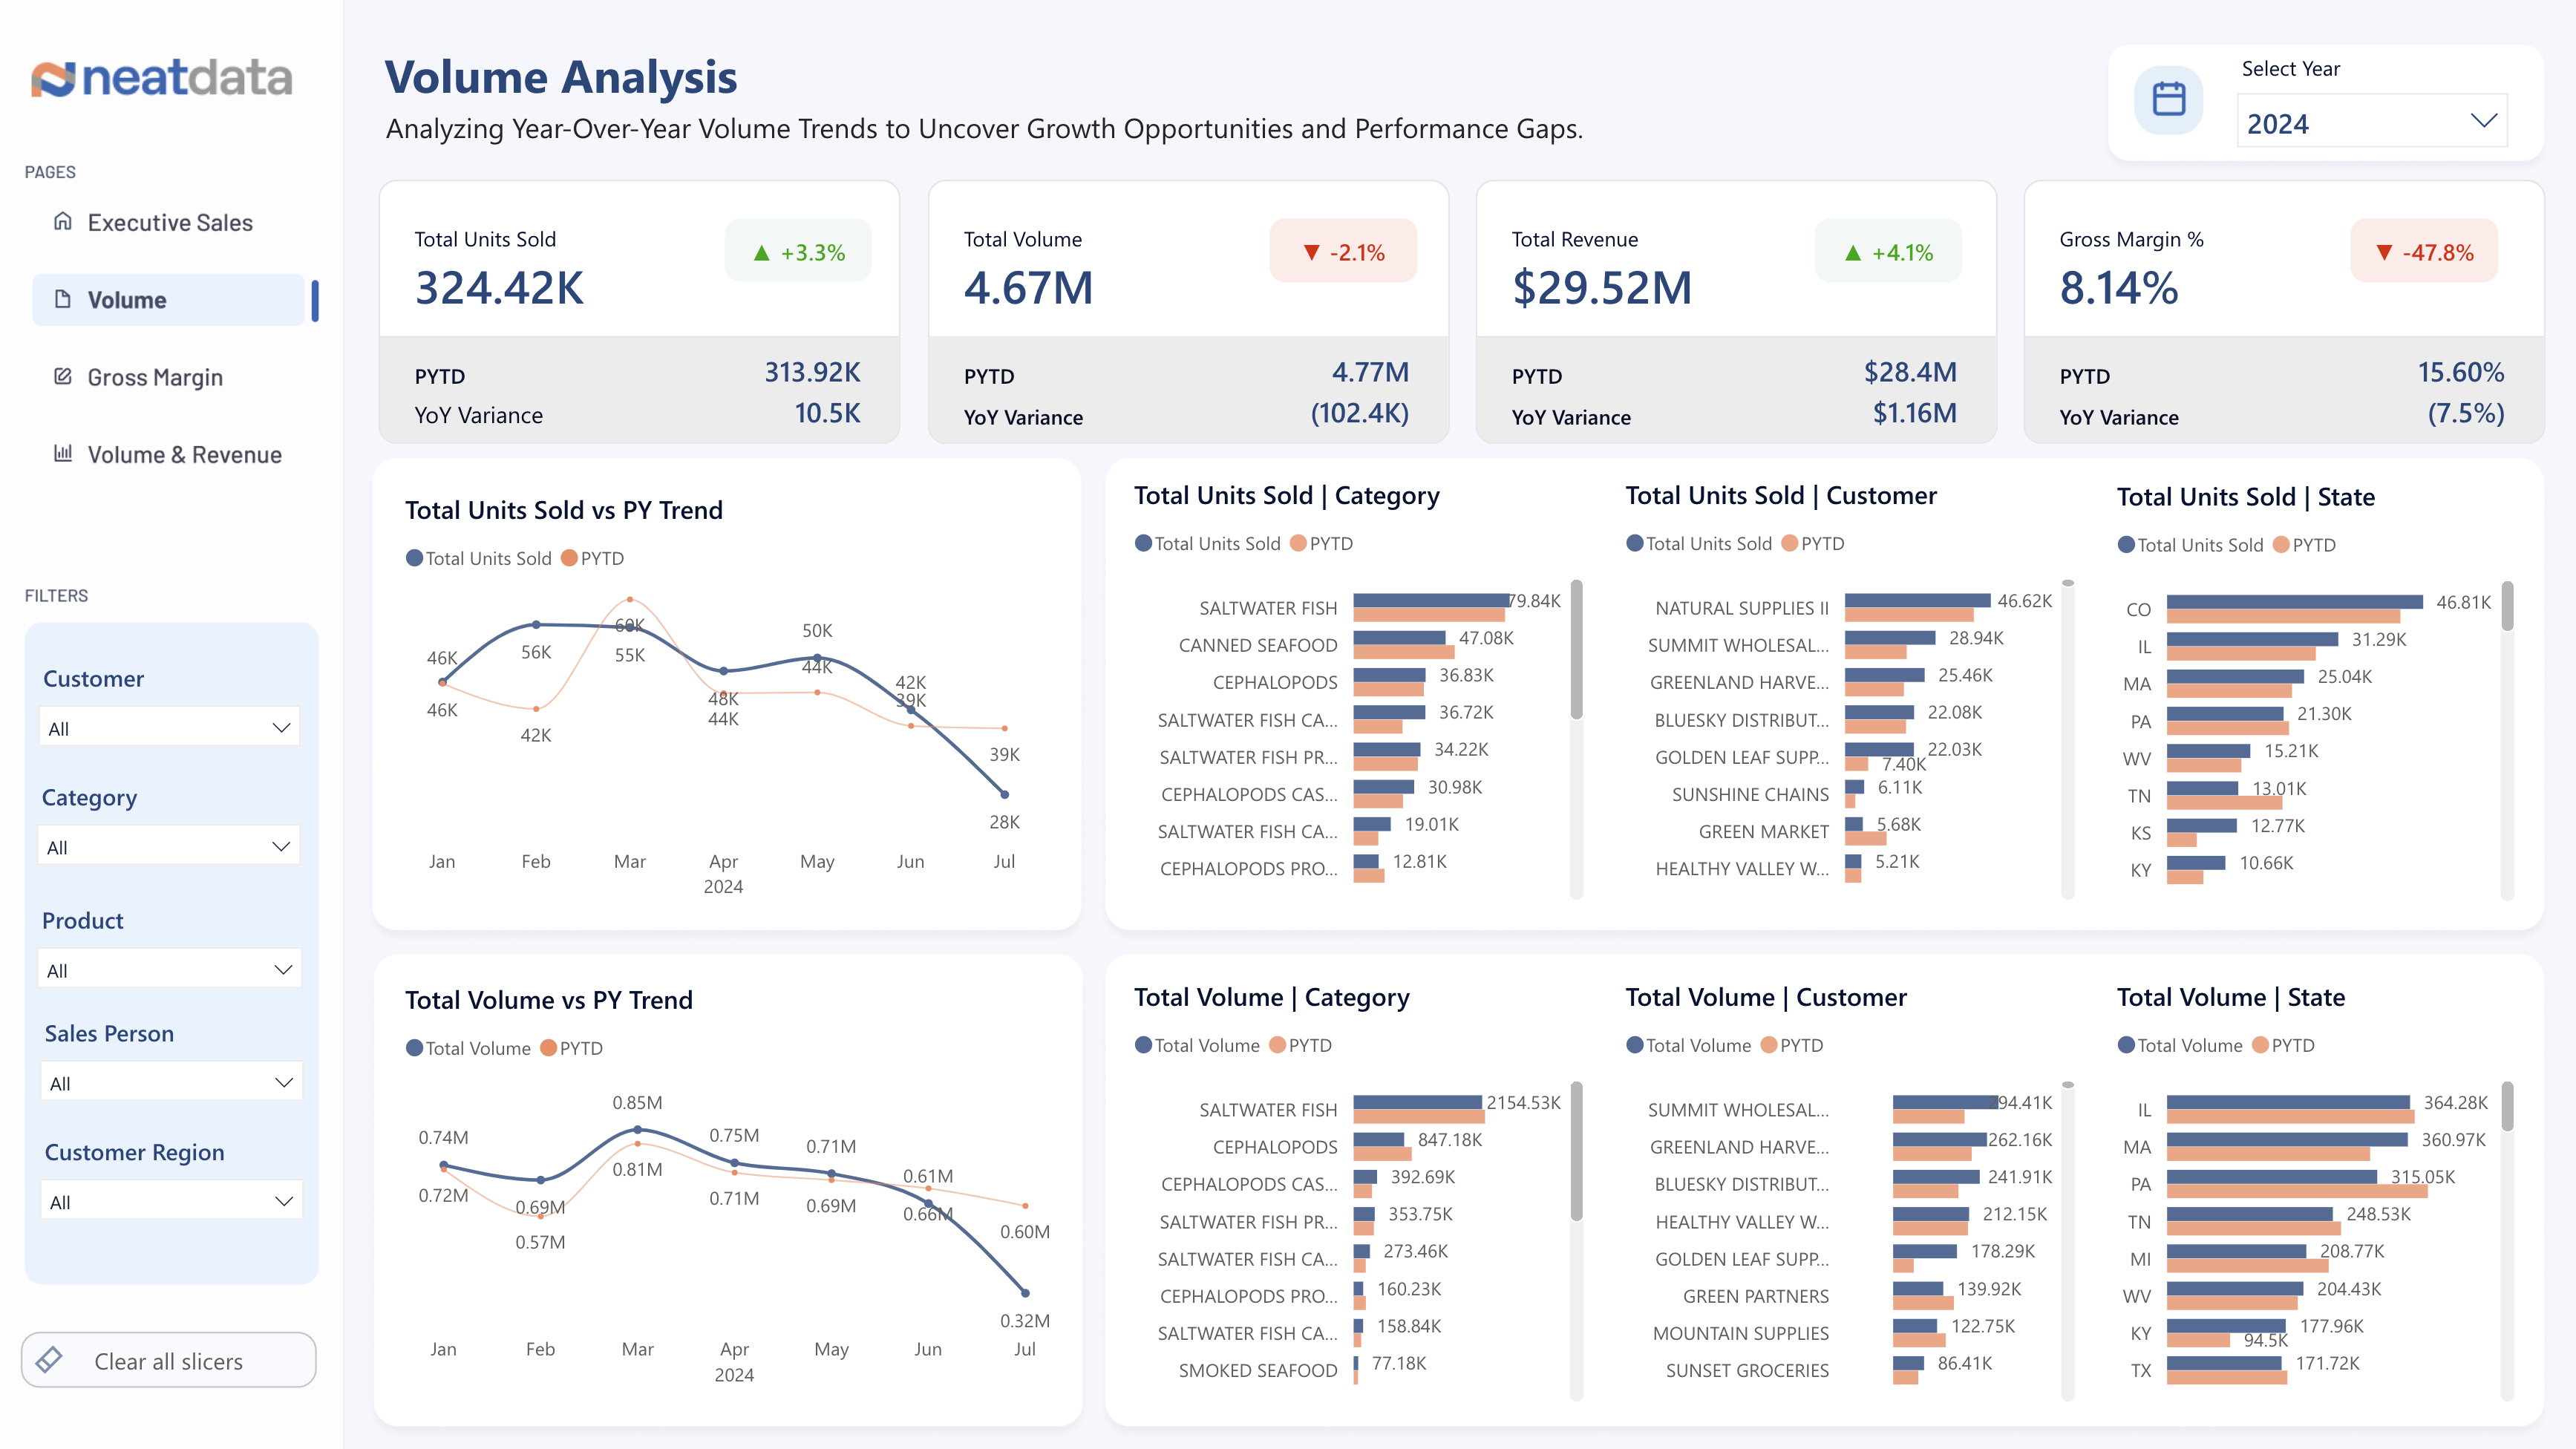
Once finance leaders view the Sales Daily Snapshot, some days they might have more time to scrutinize Gross Margin Analysis, Volume, and Revenue.


