In today’s fast-paced and data-driven world, businesses need more than gut instinct to make impactful cashflow decisions. Success stems from having the right insights, and Neat Data is here to empower accounting teams with the tools they need to thrive. Our suite of pre-built accounts payable (A/P) and accounts receivable (A/R) dashboards delivers actionable analytics, enabling you to optimize purchasing, collections, and strengthen supplier relationships.
Our data engineers integrate these dashboards with your ERP or accounting platform to ensure the analytics are updated automatically.
Let’s take a look at what these dashboards can do for your business.
Table of Contents
Accounts Payable
Pre-built dashboard list.
- Accounts Payable Overview
- Vendor Payments
- Payment Trends
- Payables Alerts
- Anomaly Detection
- Cash Flow Scenarios
Overall Business Benefits
Benefits of using Neat Data pre-built dashboards for A/P.
-
- Stronger Supplier Relationships: Ensuring timely payments improves trust and may lead to better terms.
- Improved Financial Control: Businesses can track AP trends and anomalies to prevent errors and fraud.
- Enhanced Decision-Making: Data-driven insights allow for more strategic cash flow and vendor management.
- Operational Efficiency: Reducing overdue payments and optimizing DPO improves overall financial health.
Neat Data Accounts Payable Dashboards
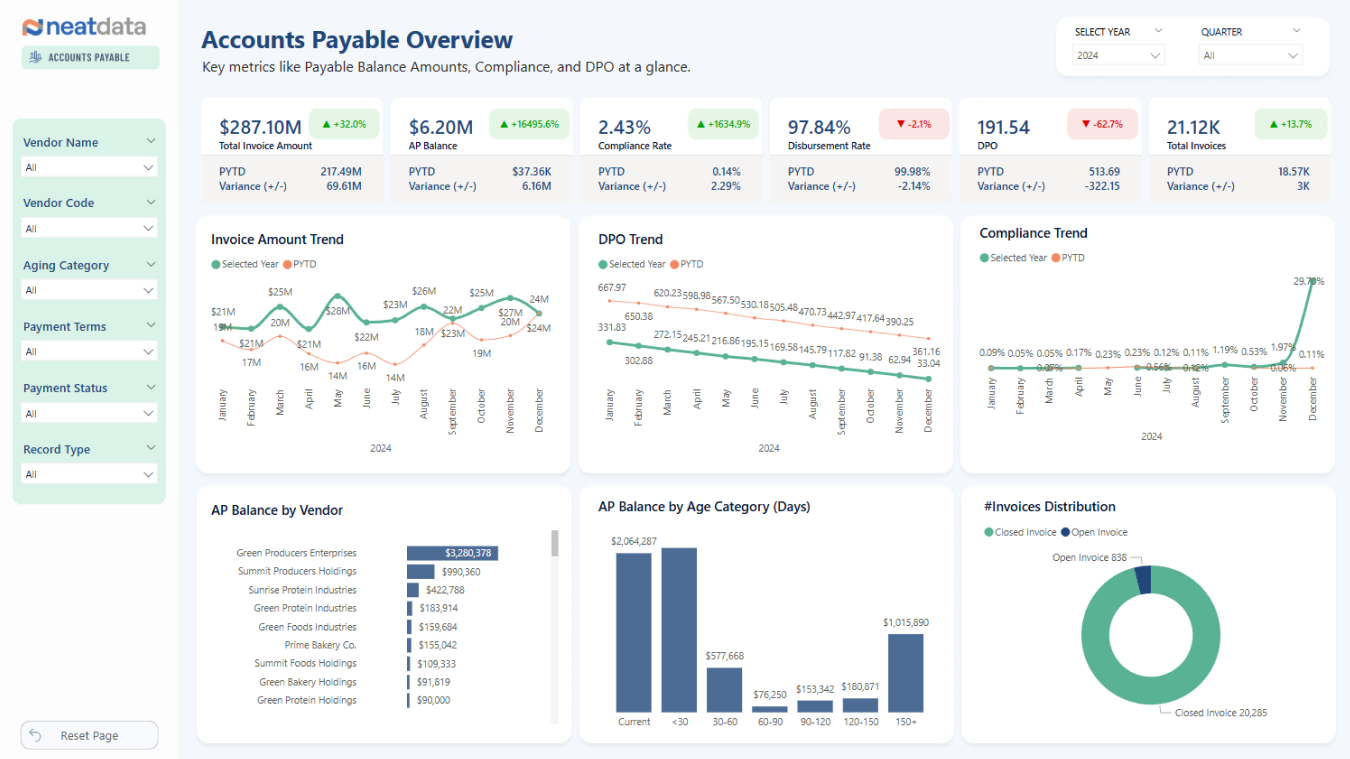
1. Accounts Payable Overview
Key Metrics Tracked:
- Total Payable Balances: Helps businesses understand the amount owed to suppliers.
- Days Payable Outstanding (DPO) Trend: Measures how long a company takes to pay its suppliers.
- Compliance Trend: Tracks adherence to payment policies.
- Invoice Amount Trend: Identifies spending patterns over time.
- AP Balance by Vendor: Shows outstanding balances by supplier.
How Businesses Can Use This Data:
- Improve Cash Flow Management: By monitoring DPO trends, businesses can optimize when to pay suppliers while maintaining good relationships.
- Ensure Compliance: Avoid penalties by tracking adherence to financial policies.
- Identify Vendor Risk: High outstanding balances with a single supplier could indicate over-reliance on one vendor.
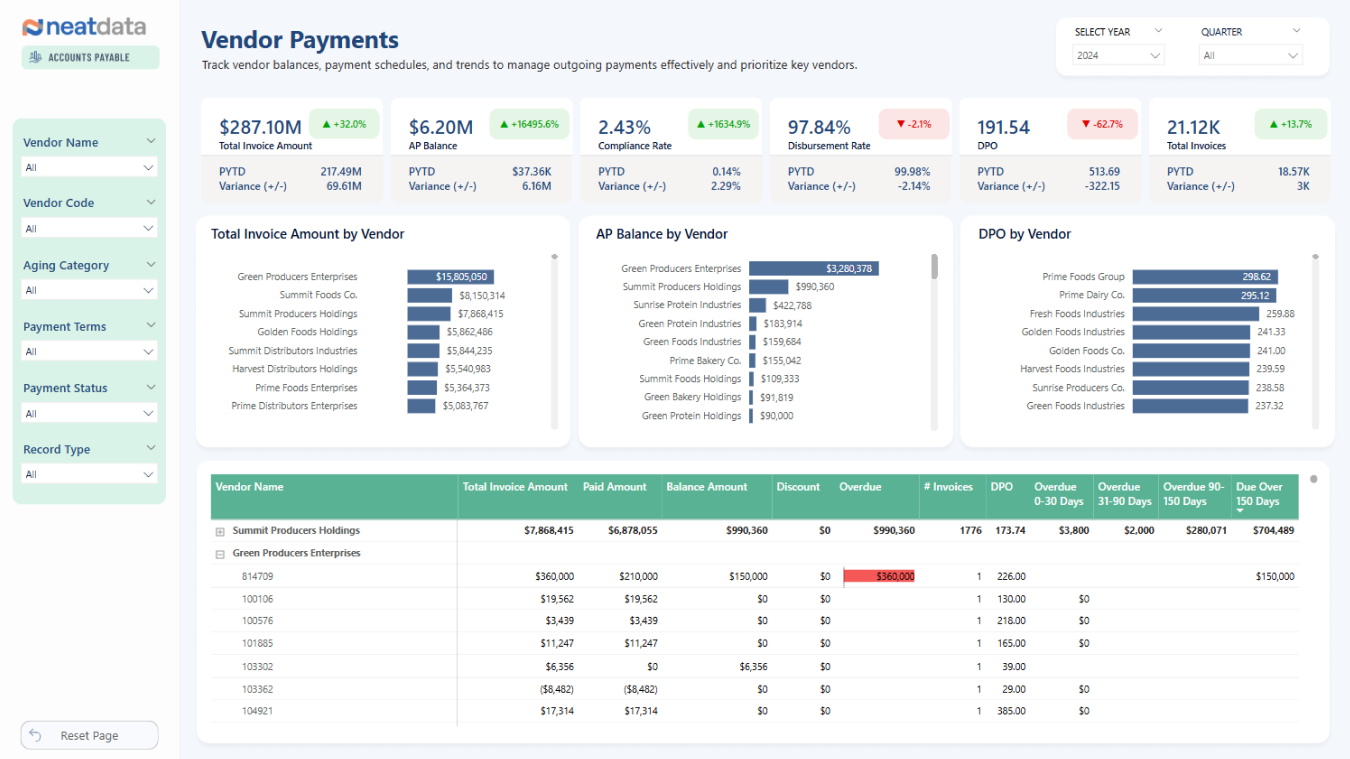
2. Vendor Payments
Key Metrics Tracked:
- Total Invoice Amount by Vendor: Shows which suppliers have the highest invoicing.
- DPO by Vendor: Compares payment timelines for different suppliers.
- Balance Amount & Overdue Status: Highlights late payments and outstanding amounts.
How Businesses Can Use This Data:
- Prioritize Key Vendors: Ensuring timely payments to major suppliers to maintain favorable terms.
- Negotiate Better Terms: Businesses can leverage this data to negotiate improved credit terms with suppliers.
- Reduce Overdue Payments: Identifying overdue invoices helps avoid late fees and strained supplier relationships.
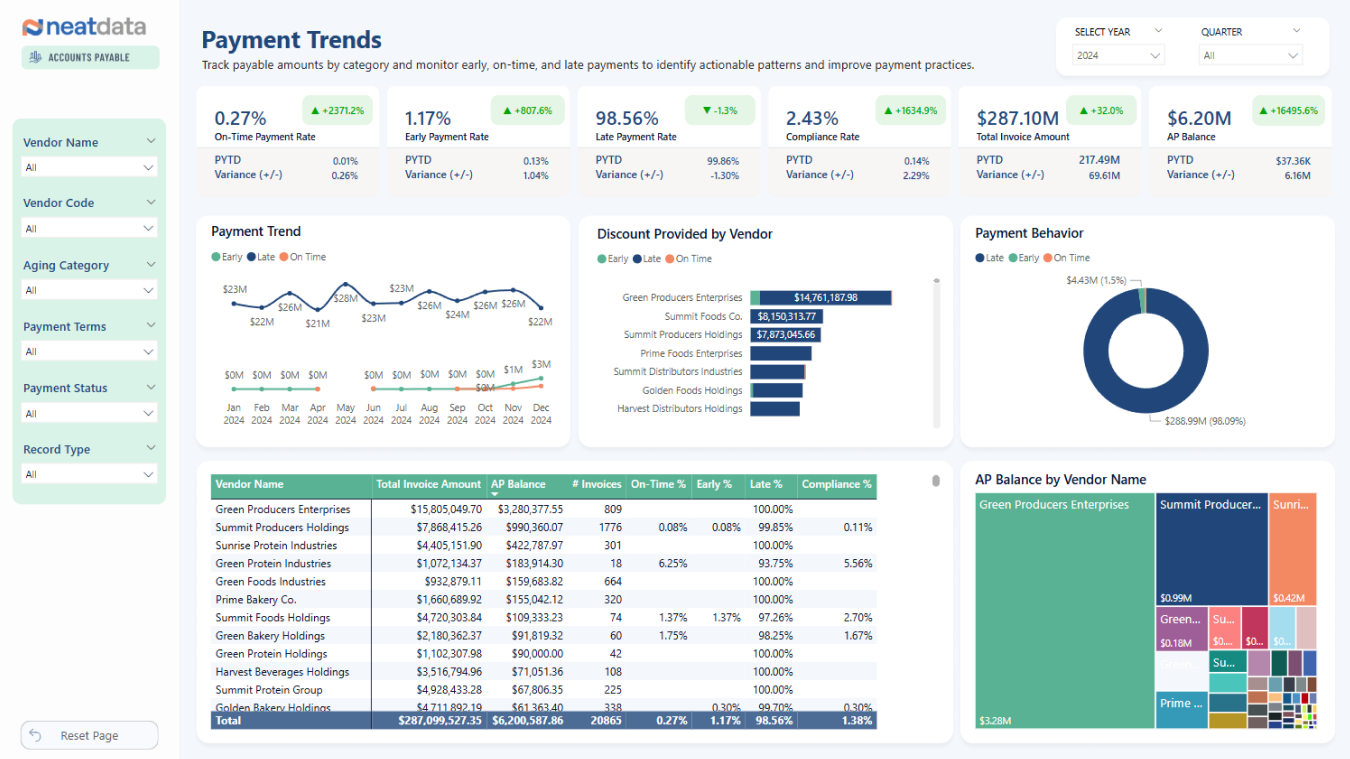
3. Payment Trends
Key Metrics Tracked:
- Early, On-Time, and Late Payments: Tracks payment behavior and timeliness.
- Discounts Provided by Vendors: Shows savings from early payments.
- Historical Payment Trend: Identifies patterns in payment behavior.
How Businesses Can Use This Data:
- Optimize Payment Strategies: Businesses can identify when early payments lead to meaningful discounts.
- Address Late Payment Risks: A high percentage of late payments may indicate poor AP process efficiency or cash flow problems.
- Improve Supplier Relations: Consistently late payments could damage supplier trust; this dashboard helps correct trends before they become problematic.
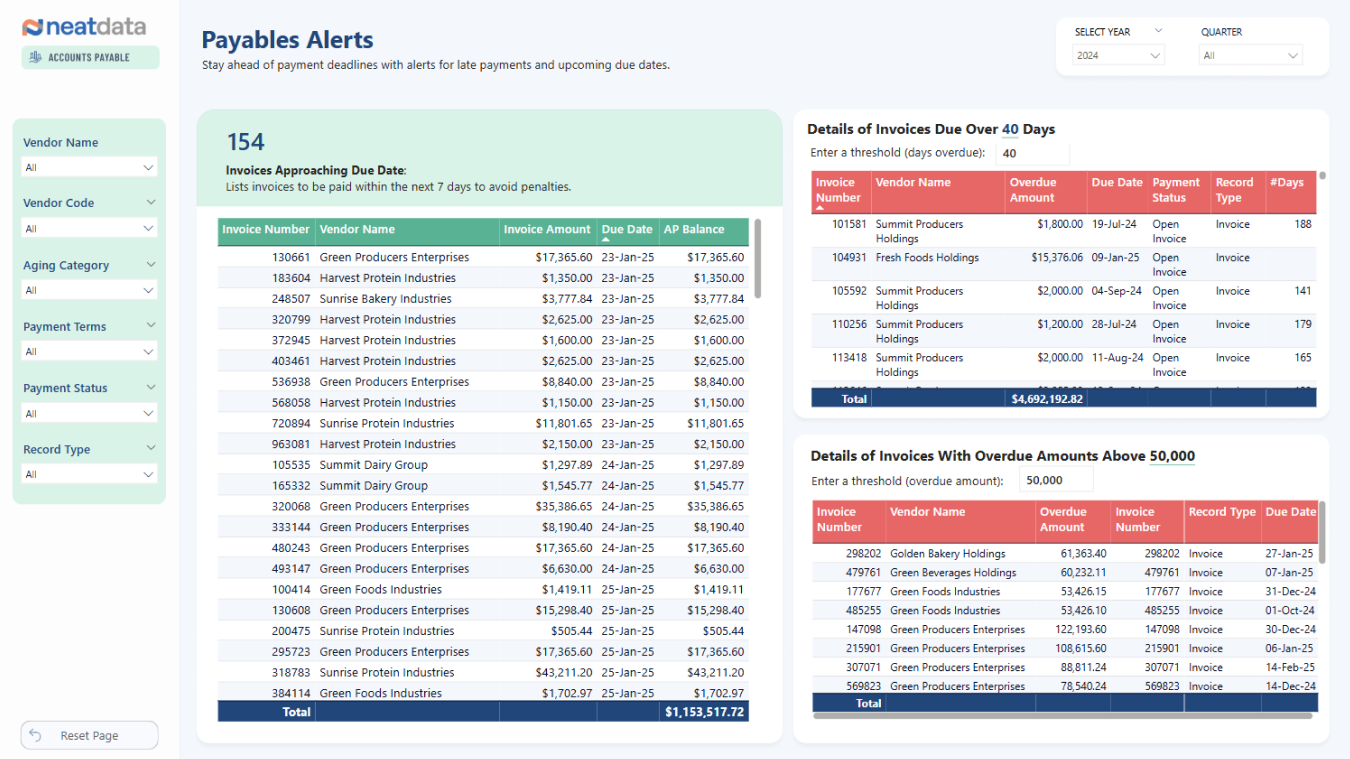
4. Payables Alerts
Key Metrics Tracked:
- Invoices Approaching Due Date: Identifies invoices that need attention.
- Overdue Invoices by Vendor: Highlights outstanding amounts with aging categories.
- High-Value Overdue Invoices: Flags invoices exceeding a certain threshold.
How Businesses Can Use This Data:
- Prevent Late Fees: Businesses can proactively address payments to avoid penalties.
- Prioritize Payments: By focusing on high-value invoices, finance teams can make strategic cash disbursements.
- Enhance Forecasting Accuracy: Identifying overdue trends can help refine financial planning.
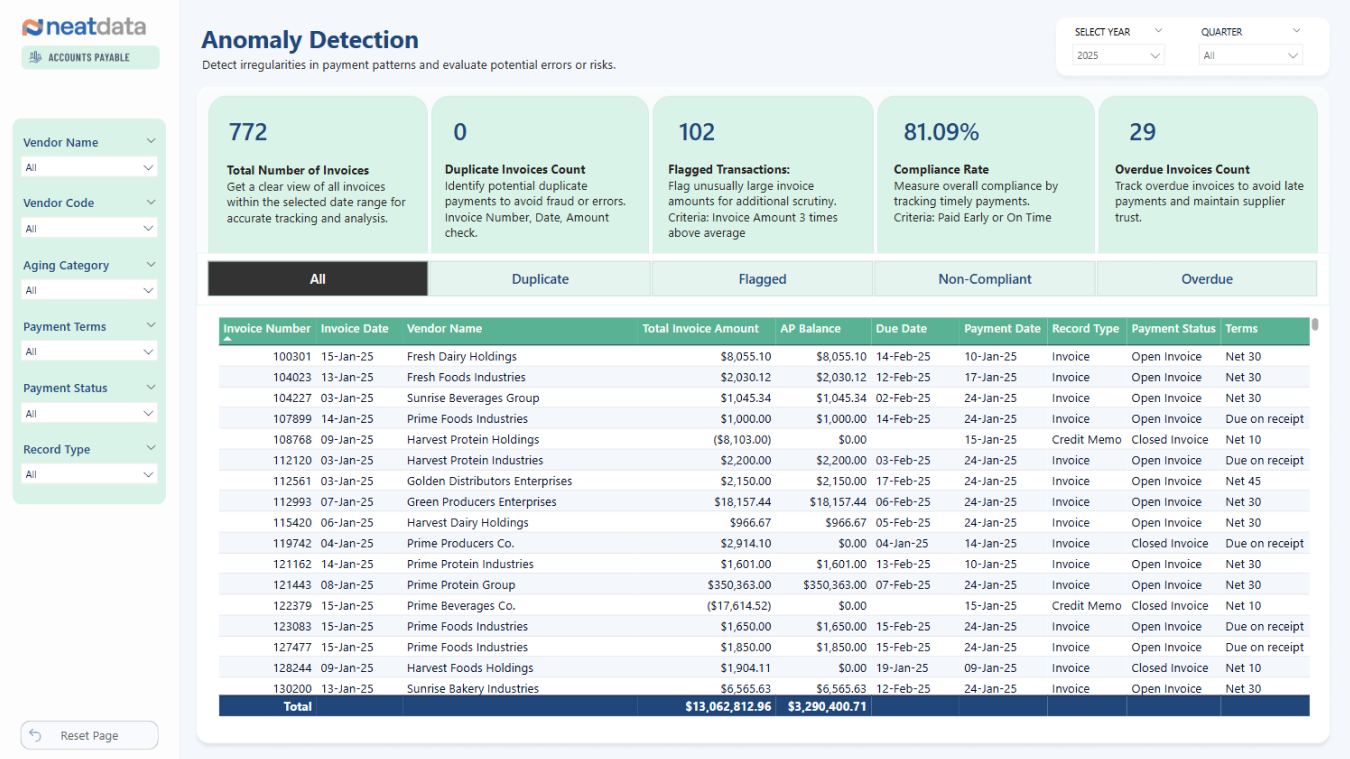
5. Anomaly Detection
Key Metrics Tracked:
- Duplicate Invoices Count: Identifies potential duplicate payments.
- Flagged Transactions: Highlights unusually large invoices for review.
- Compliance Rate: Measures how often payments follow set rules.
- Overdue Invoices Count: Tracks the number of late invoices.
How Businesses Can Use This Data:
- Prevent Fraud and Errors: Detecting duplicate invoices can prevent overpayments.
- Ensure Compliance: Monitoring flagged transactions helps identify policy violations.
- Maintain Supplier Trust: Addressing overdue invoices promptly preserves business relationships.
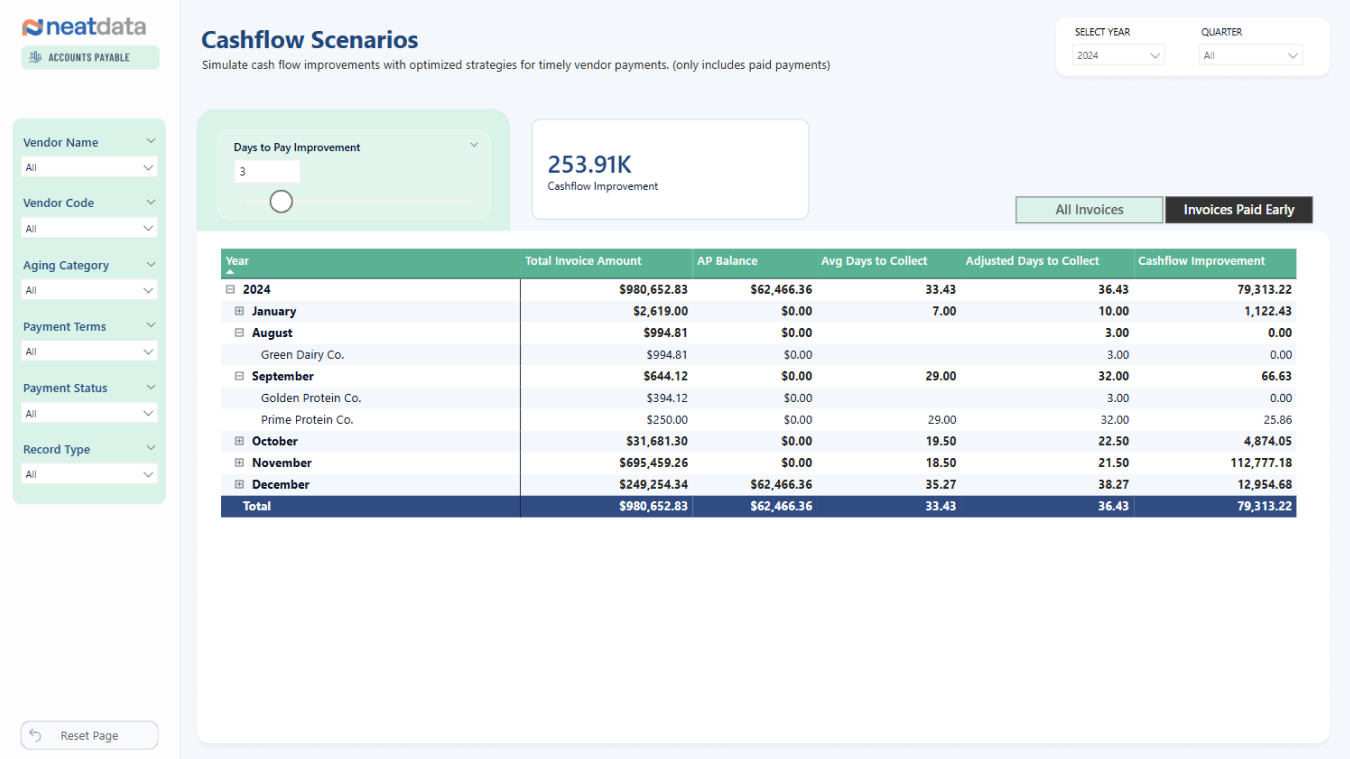
6. Cash Flow Scenarios
Key Metrics Tracked:
- Days to Pay Improvement: Measures the impact of improved payment practices.
- Cash Flow Improvement: Shows how early or delayed payments affect liquidity.
- Historical Invoice Amounts and Balances: Helps track payment timing trends.
How Businesses Can Use This Data:
- Optimize Cash Flow: Simulating different payment strategies allows businesses to manage liquidity more effectively.
- Balance Supplier Payments with Financial Health: Companies can decide whether to delay payments to improve working capital or pay early for discounts.
- Make Data-Driven Financial Decisions: Insights into payment behavior support strategic cash allocation.
Accounts Receivable
List of pre-built dashboards.
- A/R Overview
- Customer Balances
- Outstanding Analysis
- Payment Trends
- Sales Rep Performance
- Due Alerts
- Cash Flow Scenarios
Overall Business Benefits
Benefits of using Neat Data pre-built dashboards for A/R.
-
- Stronger Cash Flow Management: Ensuring timely collections improves financial stability.
- Improved Customer Credit Control: Identifying late-paying customers helps in refining credit terms.
- Data-Driven Decision Making: Businesses can use A/R trends to adjust pricing, credit policies, and sales strategies.
- Enhanced Financial Forecasting: Reliable A/R insights improve cash flow projections and planning.


Neat Data Accounts Receivable Dashboards
1. A/R Overview
Key Metrics Tracked:
- Total Outstanding Amounts: Amounts still due from customers.
- Overdue Invoices: Identifies unpaid invoices past due dates.
- Days Sales Outstanding (DSO) Trend: Measures how quickly receivables are collected.
- Customer Outstanding Amounts: Highlights key customers with unpaid balances.
- Sales Reps with High Outstanding Balances: Shows which reps’ customers have the most overdue invoices.
How Businesses Can Use This Data:
- Improve Cash Flow Management: Reducing DSO ensures quicker cash inflow.
- Strengthen Collection Efforts: Identifying customers with large overdue balances allows for targeted follow-ups.
- Monitor Sales Rep Performance: Holding sales reps accountable for their clients’ payments can improve collections.
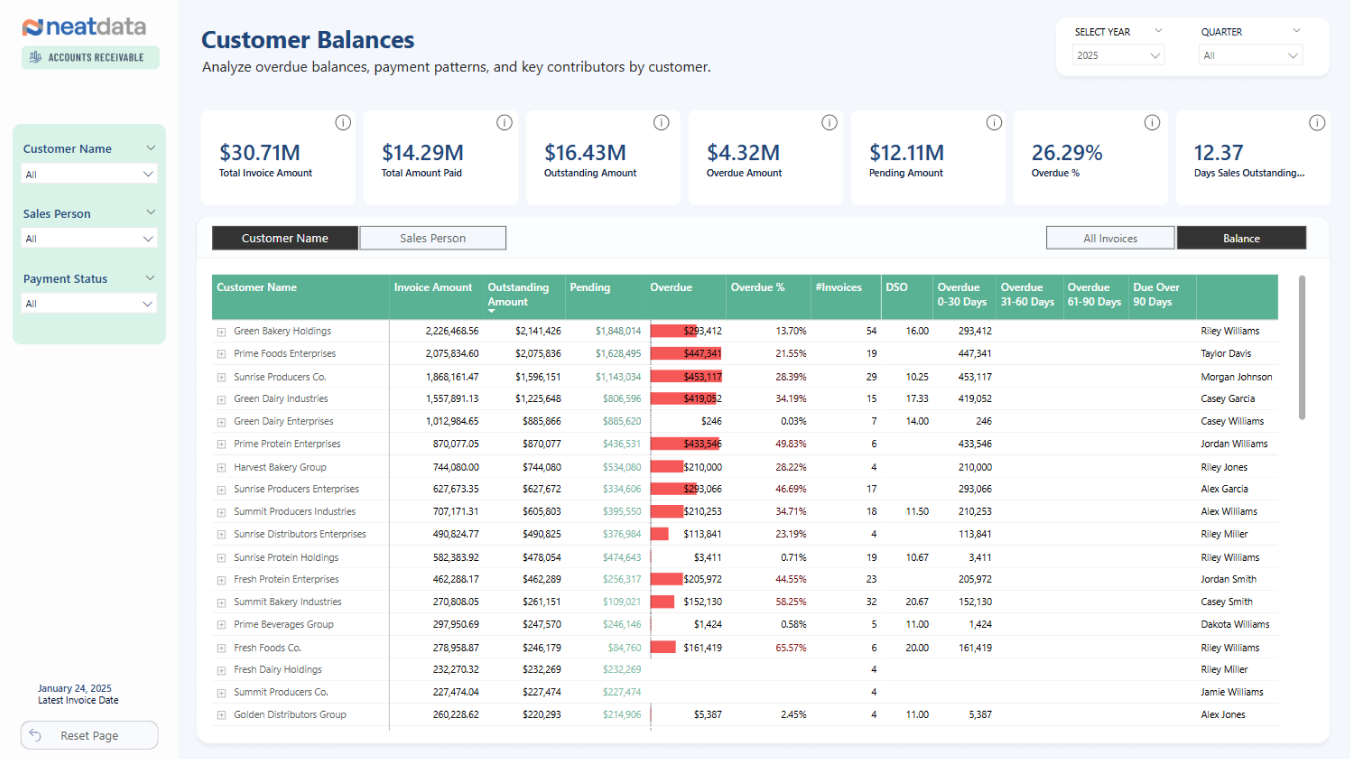
2. Customer Balances
Key Metrics Tracked:
- Customer-Level A/R Balances: Identifies which customers owe the most.
- Overdue Amount by Age Category: Breaks down overdue balances by how late they are (e.g., 30-59 days, 60-89 days).
- Pending vs. Overdue Amounts: Separates unpaid invoices into overdue and not-yet-due categories.
- Days Sales Outstanding (DSO): Tracks how long it takes to collect from each customer.
How Businesses Can Use This Data:
- Prioritize Collections: Focus efforts on high-value overdue customers.
- Address Chronic Late Payers: Customers with high DSO should be reviewed for credit risk.
- Negotiate Payment Terms: If a customer consistently pays late, adjusting terms or offering early payment discounts could be beneficial.
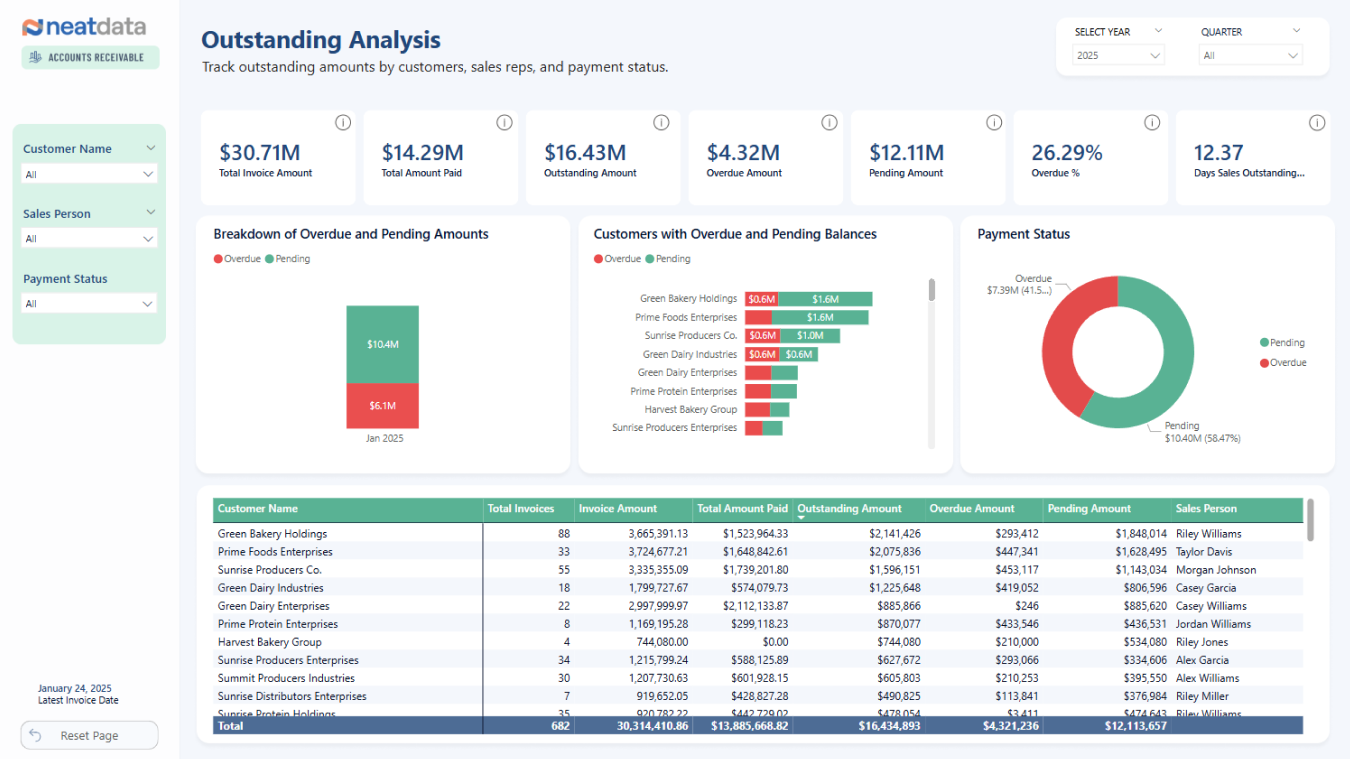
3. Outstanding Analysis
Key Metrics Tracked:
- Pending vs. Overdue Balances: Provides an aging report for outstanding invoices.
- Breakdown by Customer & Sales Rep: Shows which accounts have the largest overdue balances.
- Trends in Unpaid Invoices: Helps track collection efforts over time.
How Businesses Can Use This Data:
- Improve Forecasting: Understanding payment behavior helps refine cash flow projections.
- Enforce Payment Discipline: Identifies habitual late payers to take action against.
- Optimize Credit Limits: If a customer consistently delays payments, consider adjusting credit terms.
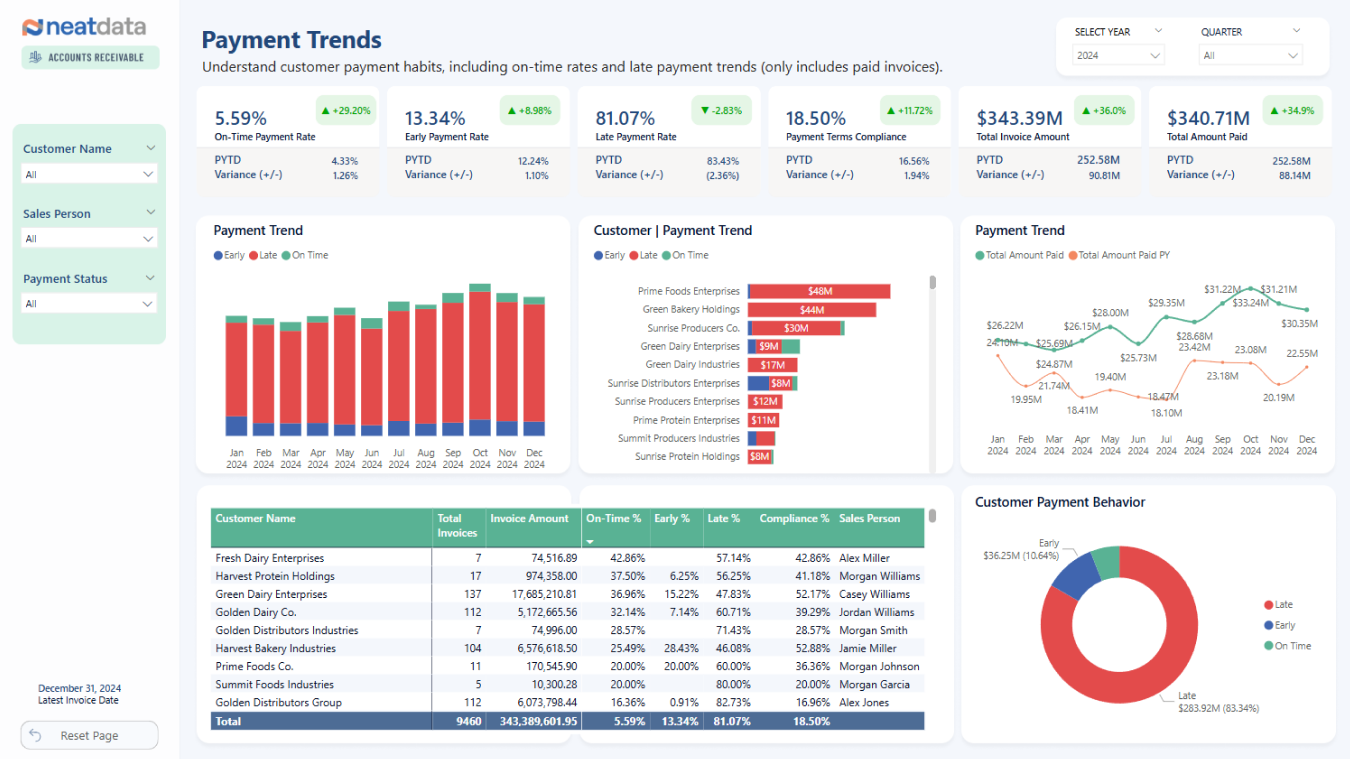
4. Payment Trends
Key Metrics Tracked:
- On-Time, Early, and Late Payment Rates: Analyzes how customers adhere to payment schedules.
- Historical Payment Behavior: Shows trends in when invoices get paid.
- Payment Terms Compliance: Tracks whether customers meet agreed payment terms.
How Businesses Can Use This Data:
- Encourage Early Payments: Offering discounts for early payments can improve cash flow.
- Address High Late Payment Rates: If most customers are paying late, reviewing payment terms and follow-up strategies is necessary.
- Monitor Customer Reliability: Customers with consistently late payments might require stricter terms.
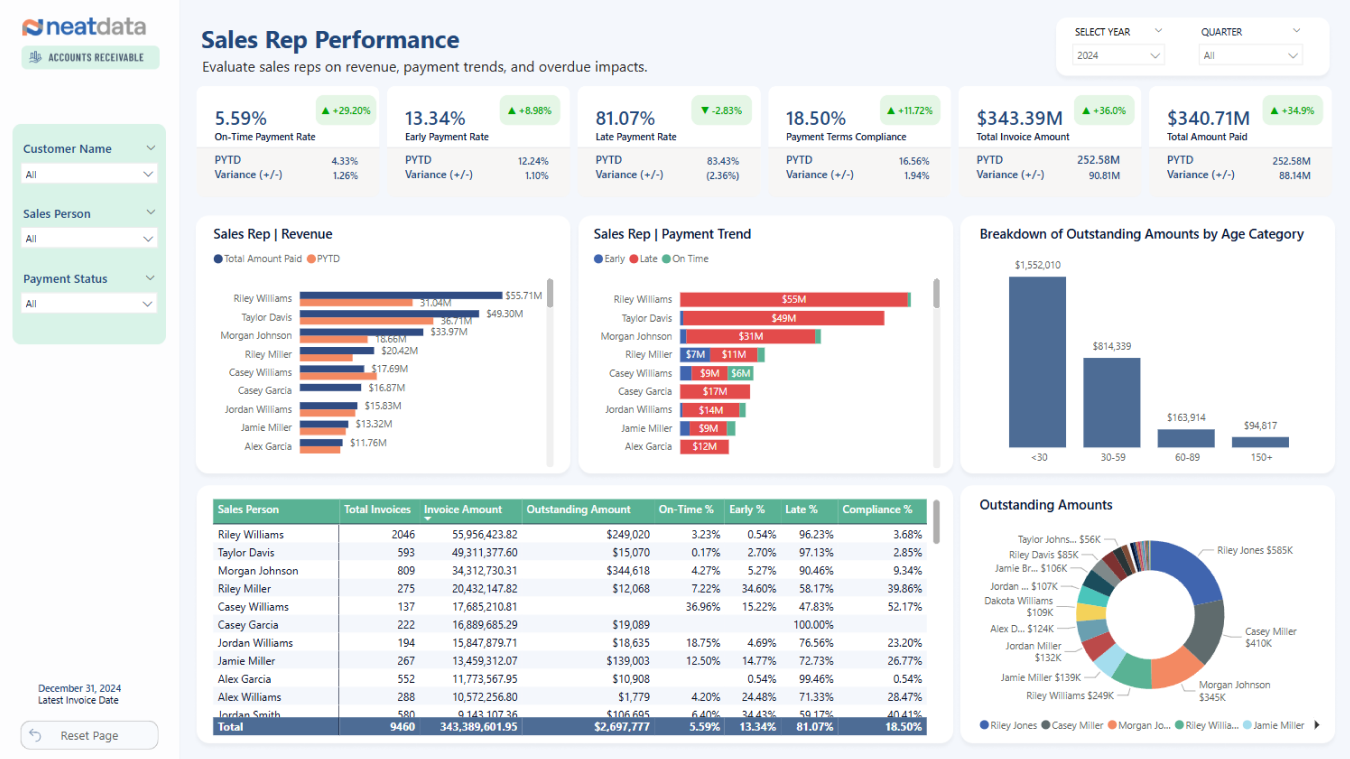
5. Sales Rep Performance
Key Metrics Tracked:
- Outstanding Amount by Sales Rep: Tracks which sales reps have the most overdue customers.
- Revenue vs. Collection Impact: Compares reps’ revenue contributions to overdue balances.
- Payment Behavior by Rep’s Customers: Identifies reps associated with late-paying clients.
How Businesses Can Use This Data:
- Hold Sales Reps Accountable: Linking commissions to payment collection ensures reps focus on quality sales.
- Align Sales and Finance Goals: Encouraging sales teams to work with finance on collections can reduce overdue amounts.
- Refine Customer Targeting: If certain reps consistently work with late-paying customers, their prospecting strategy might need adjustments.
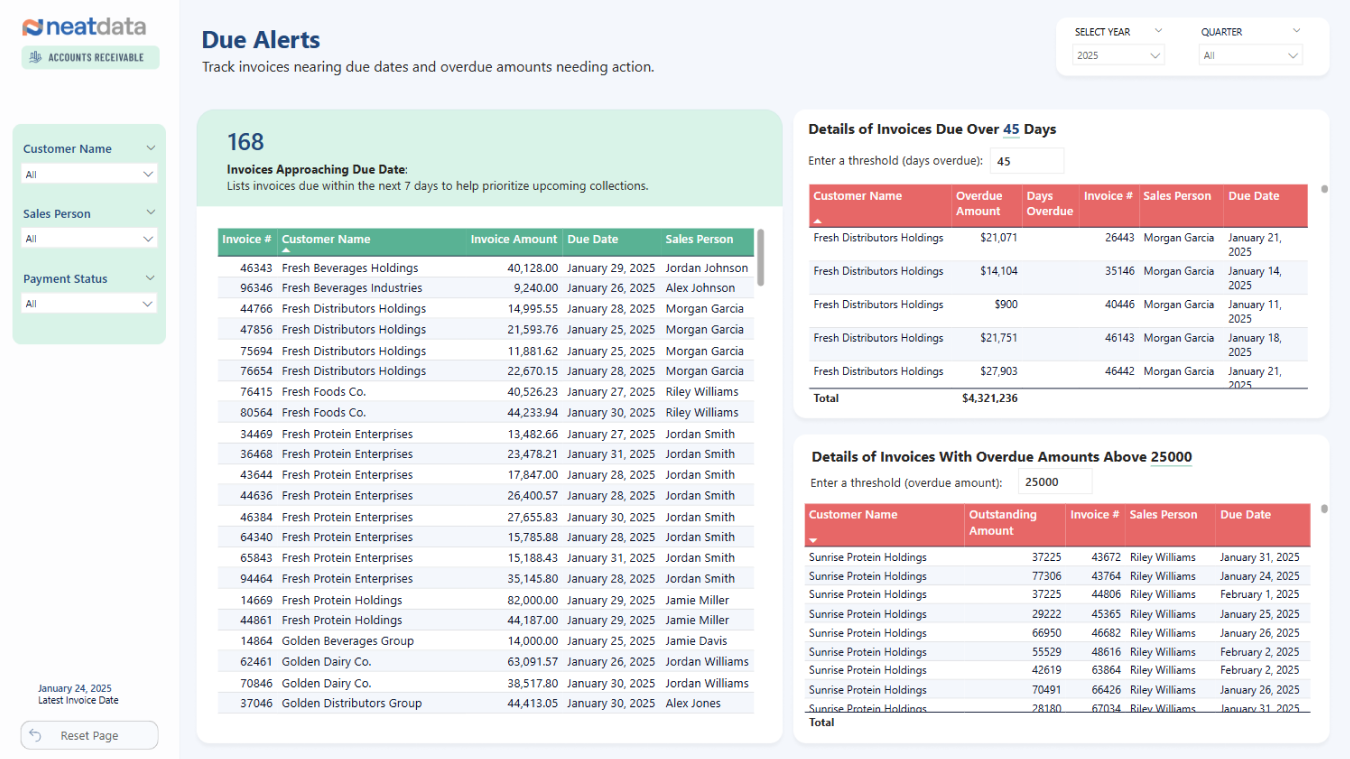
6. Due Alerts
Key Metrics Tracked:
- Invoices Nearing Due Dates: Lists invoices requiring immediate follow-up.
- Overdue Amounts by Customer: Highlights overdue invoices with aging categories.
- Invoices Over a Certain Age or Amount: Allows setting thresholds to flag high-risk accounts.
How Businesses Can Use This Data:
- Prevent Late Payments: Automated follow-ups on upcoming due dates can improve on-time collections.
- Reduce Bad Debt Risk: Proactively managing overdue accounts reduces the likelihood of non-payment.
- Improve Cash Flow Predictability: Having visibility into near-due and overdue payments helps finance teams plan more effectively.
7. Cash Flow Scenarios
Key Metrics Tracked:
- Days to Collect Improvement: Measures the impact of faster collections.
- AR Cash Flow Improvement: Estimates financial impact if payments were collected earlier.
- Historical Invoice Collections: Analyzes how quickly invoices have been settled over time.
How Businesses Can Use This Data:
- Optimize Collection Strategies: Businesses can simulate how different collection strategies improve cash flow.
- Set Realistic Payment Goals: Understanding how quickly customers historically pay allows better financial planning.
- Enhance Working Capital Efficiency: Faster collections enable reinvestment into business growth.
With Neat Data’s comprehensive set of A/P and A/R dashboards, you’ll have the tools you need to track spending, improve cash flow, and drive measurable business success. Ready to transform your A/P and A/R processes? Let’s take the next step together.